Health effects of air pollution are well known. Air pollution can cause everything from triggering an asthma attack to impairing our ability to make decisions. For more than a decade, research has found that traffic pollution is particularly bad for kids’ health, leading to reduced lung function and growth and affecting student performance in school.
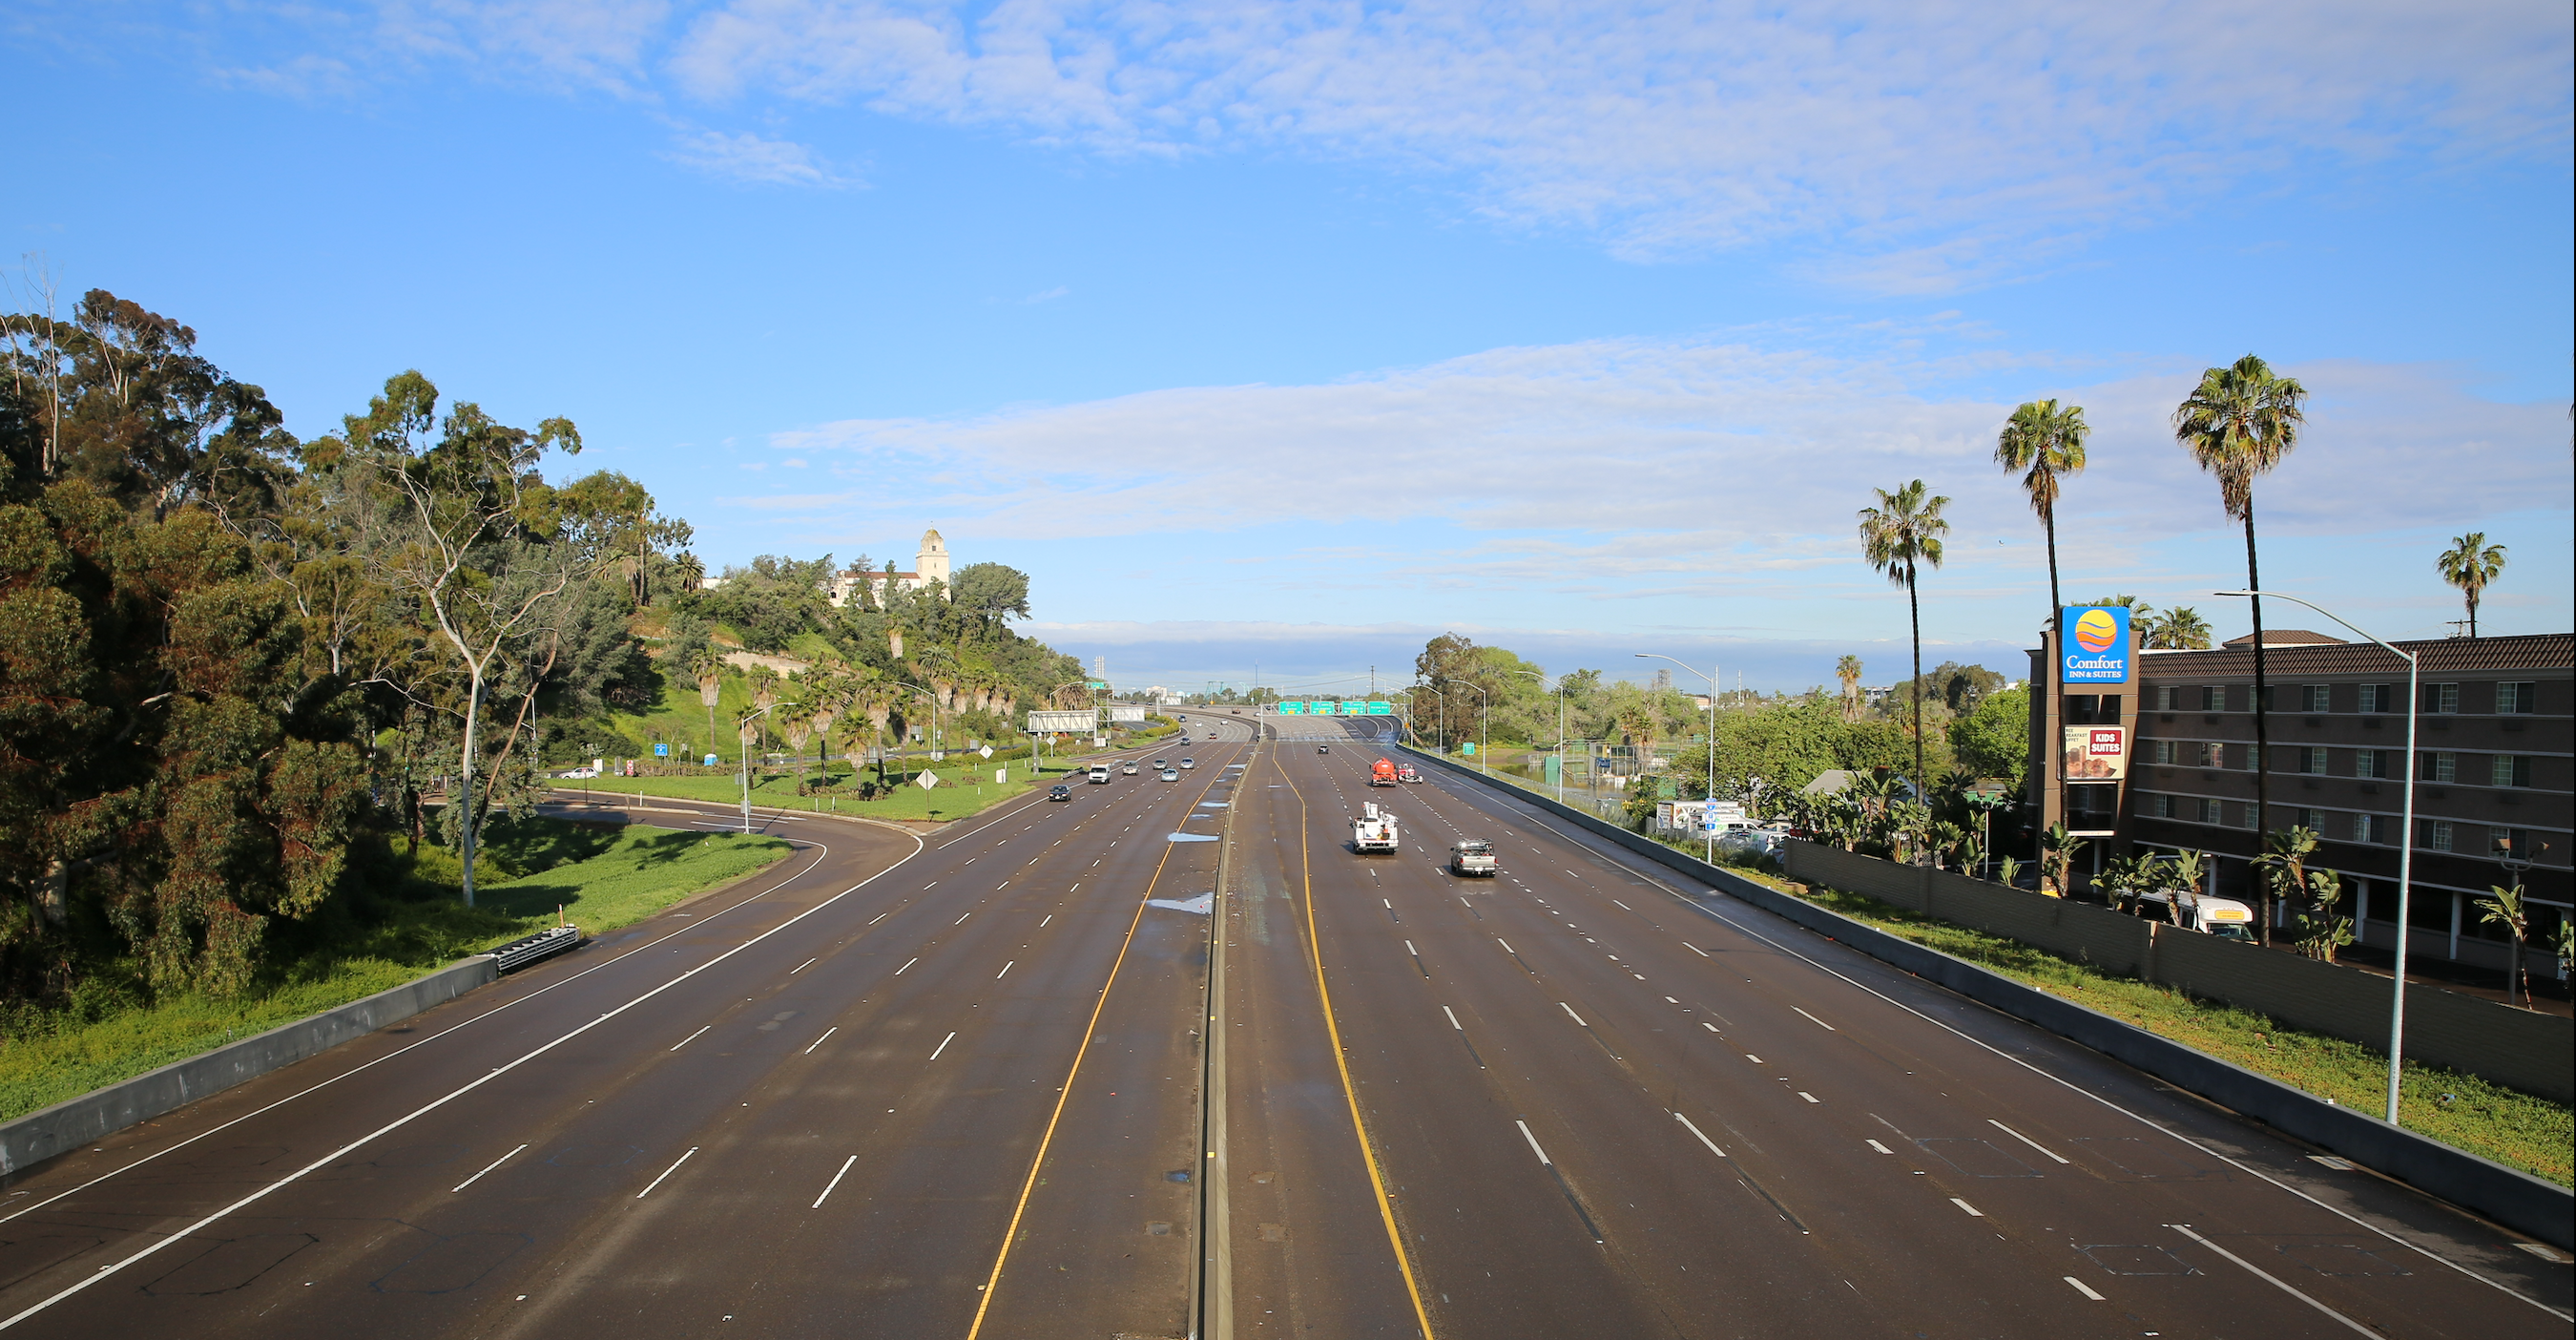
More than 1.2 million people live in high-pollution zones within 500 feet of a Southern California freeway. And nearly 8,000 U.S. public schools lie within 500 feet of highways, truck routes, and other roads with significant traffic. In other words, that’s nearly 10 percent of public school students. Despite a 2003 state law that prevents schools from being built within 500 feet of a freeways and evidence that vehicular emissions harms children’s lungs, Los Angeles school districts have used exceptions in the law to keep building.
For three months, we collected air quality data in a number of communities in Los Angeles. Our air pollution mapping took us by the different elements that make up these communities, including schools. Our hyperlocal data allows us to examine air pollution levels near these schools to identify factors that may contribute to higher concentrations, providing direction on schools to target with exposure reduction strategies.
What We Found
We focused on how levels of the pollutant black carbon varied between schools. Black carbon is a sooty black material emitted as particulates from gas and diesel engines, coal-fired power plants, biomass burning, and other processes that burn fossil fuel. Black carbon is harmful to human health and in urban regions it is an indication of the presence of diesel soot, which has been declared a carcinogen by the World Health Organization. Black carbon itself is an unregulated air pollutant, but it can be a significant fraction of PM2.5, which is regulated under the National Ambient Air Quality Act.
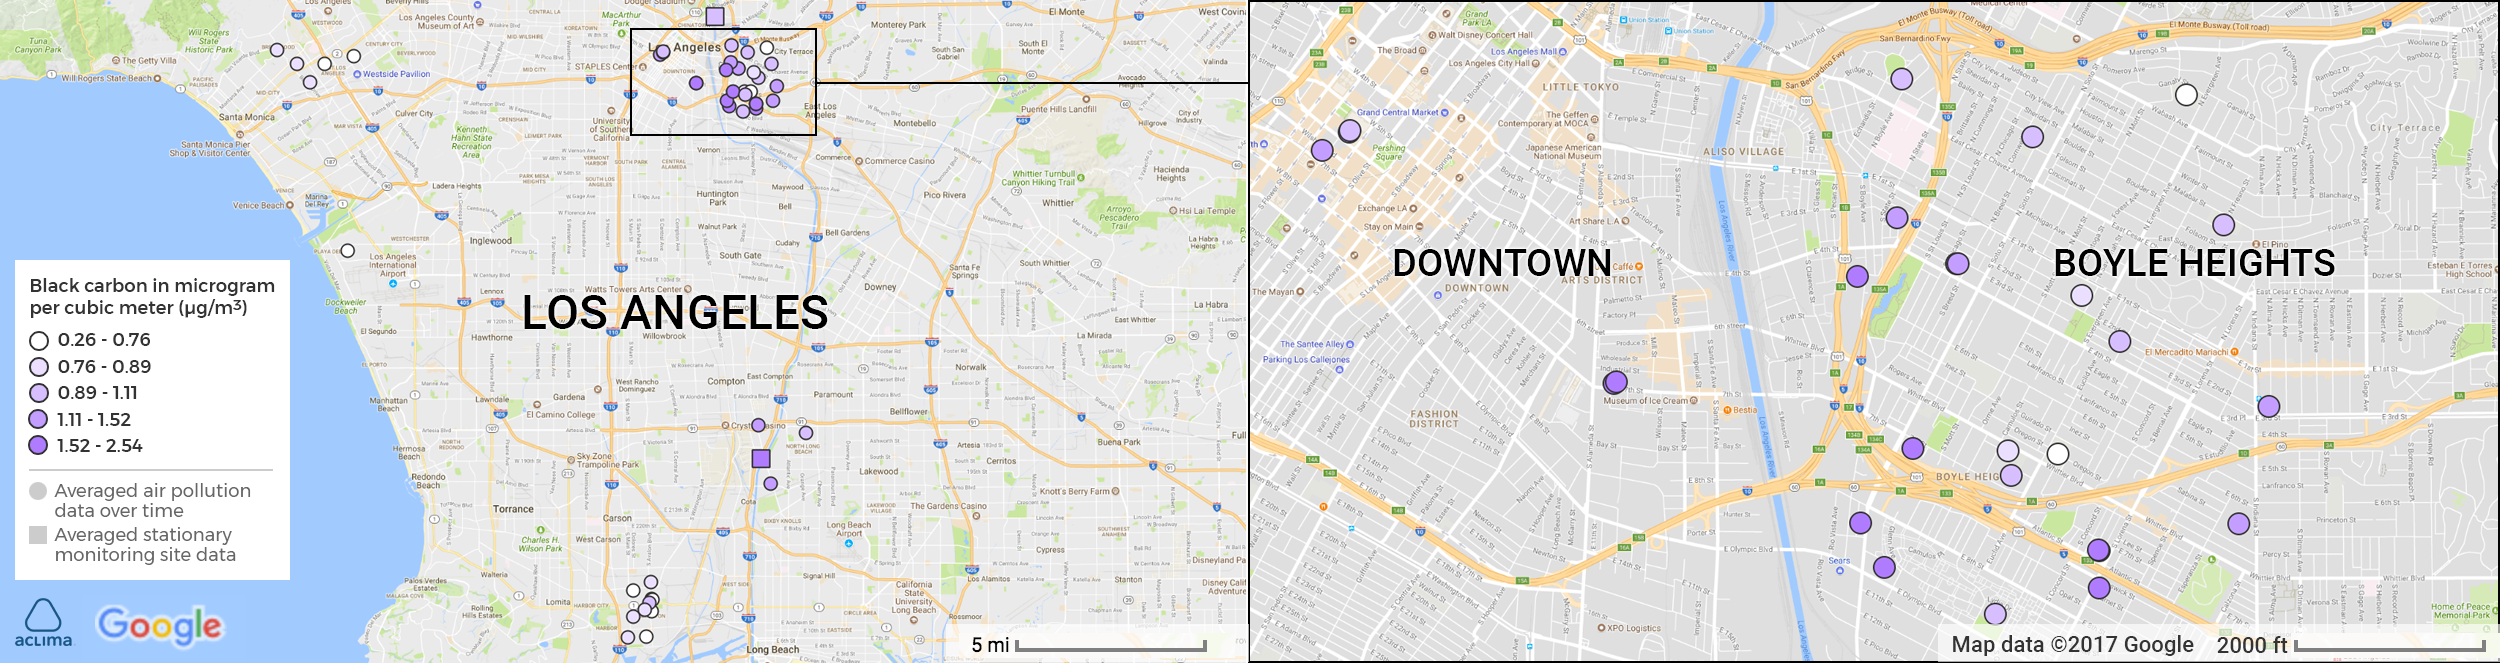
The circles on the maps below show mean black carbon concentrations measured within 500 meters around schools in the regions where we drove over our three month period in Los Angeles. The darker the circle, the higher the levels of black carbon. In general, schools closer to the coast tend to have lower levels of black carbon. Schools near the coast are closer to cleaner, coastal air that is typically blown inland by westerly winds. These schools may also not be as close to sources.
When looking at all of the data on the map, Downtown and Boyle Heights stand out as the regions where we measured the highest levels of black carbon nearby schools. Boyle Heights is surrounded by four freeways, and is located near industrial and manufacturing facilities. Of all the neighborhoods we measured, Boyle Heights is likely the most impacted by proximity to diesel emissions. In contrast, black carbon concentrations near schools in Wilmington, a community located near the Ports of Los Angeles and Long Beach with heavy rail, truck, and ship industrial activity, fared better. This may be due, in part, to the Port of Los Angeles’ Clean Truck Program that aims to reduce truck emissions near communities surrounding the ports, as well as persistent coastal winds that bring cleaner air into the region.
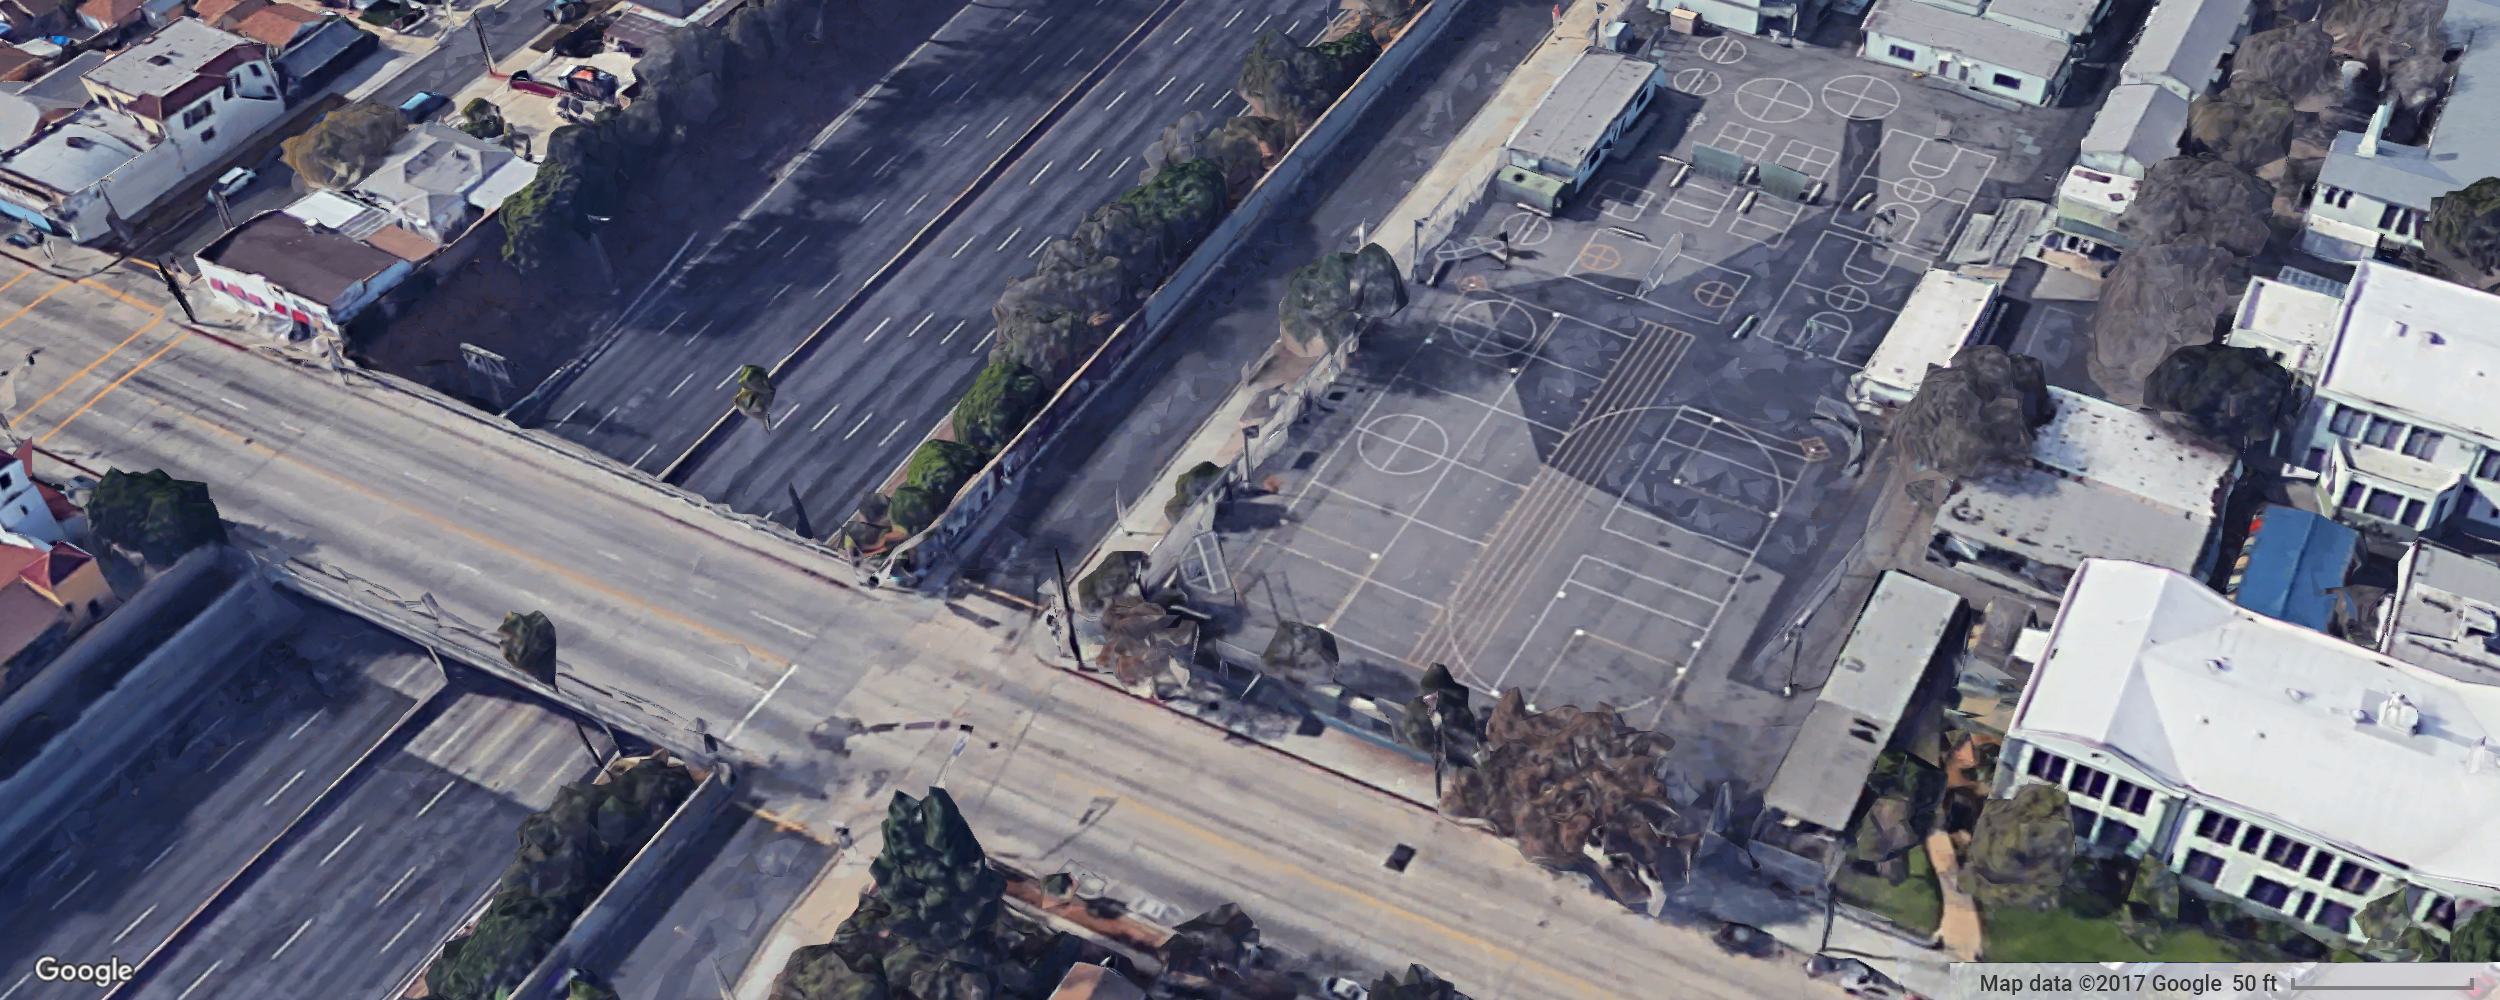
The levels of black carbon show significant variability between schools — even between schools that are located only a few blocks apart. This variability is a product not only of nearness to sources, but also the meteorology in the area. The effect of wind speed and wind direction on air pollution is complex due to the influence of the local urban landscape — the buildings, streets, and vegetation — and can vary over the length scales of city blocks.
The need for hyperlocal information like this is important to understanding our individual exposure to pollutants in areas where we spend our days. Right now, we rely on data provided by our state and local air quality regulatory agencies to tell us the current conditions. The Los Angeles region has two regulatory monitoring stations that measure black carbon; one just northeast of Downtown and one in North Long Beach.
The average black carbon levels from these two stations measured during the dates and times we drove are shown as squares on the map. The measurement at the North Long Beach station is relatively high (1.75 ug/m3). This stationary site was specifically placed right next to I-710 to measure near-freeway pollution. The amount of black carbon measured at the Downtown station is similar to the range of values measured near the schools in the region. However, this analysis resulting from our hyperlocal data demonstrates how much each individual school can vary from this regulatory measurement, revealing a more granular view of air quality in these neighborhoods.
How We Did It
The two cars were deployed daily using a base near Downtown Los Angeles during the hours of 9:00 am and 5:00 pm. Transit time narrowed the hours between which we mapped individual neighborhoods. Our drive plans were created to equally capture morning, noon, and afternoon hours when possible. We measured the pollutants nitrogen dioxide, nitric oxide, ozone, black carbon, and particulate matter.
Black carbon concentrations were calculated from measurements within 500 meters of the school. We excluded schools where there wasn’t sufficient sampling to expect a representative value, such as a school that is near a freeway where our cars only passed by but did not drive surface streets around the school. The graphs only show schools with at least 1,000 data points in at least three days of driving. The the contribution of data collected on highways to the mean value was no more than 15%. We report distance-weighted averages.
AQ&U
More schools around the world are confronting outdoor air pollution and its effects on students in class. This level of hyperlocal information can help explain real-time air quality conditions and inform how schools are protecting students and teachers from these conditions. Air filters installed in schools nearest freeways is one solution to protect students from outdoor air while they are indoors. Siting schools farther away from heavy traffic corridors and stationary sources will also reduce exposure. See the EPA’s best practices for reducing near-road pollution exposure at schools.
Learn More
To request the data from this data snapshot, please apply here. Read our data snapshots of the Bay Area and the Central Valley to learn about the worst wildfire season in California’s history, and what we found when we started mapping methane hot spots in the Valley.
Share this
Environmental Data to Empower Community-Driven Solutions
Taking it to the Streets: Aclima Brings Street-Level Environmental Sensing to CicLAvia