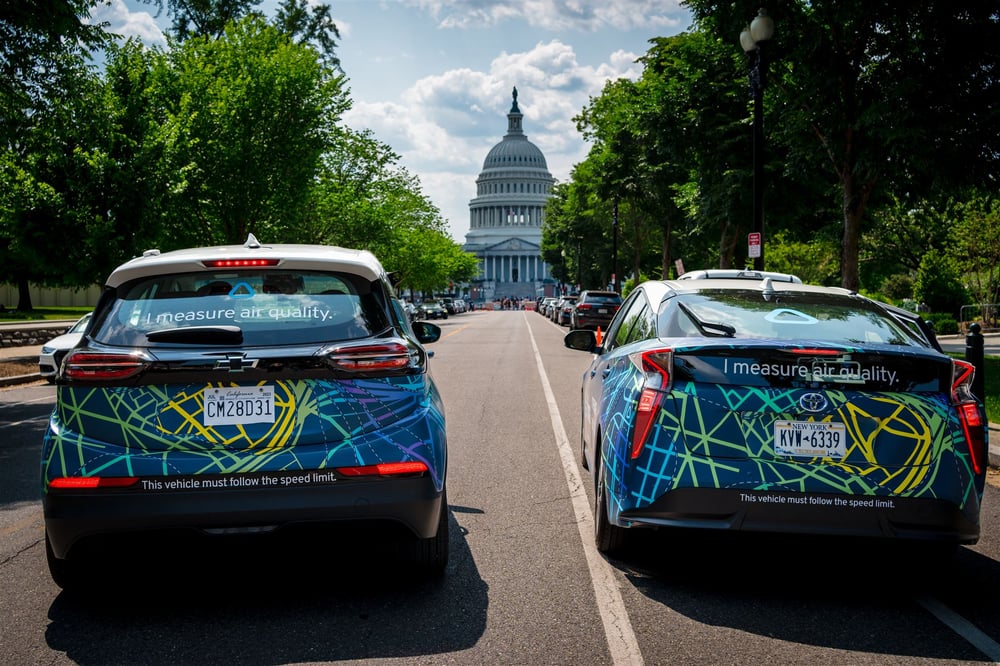
Block-by-block data collection
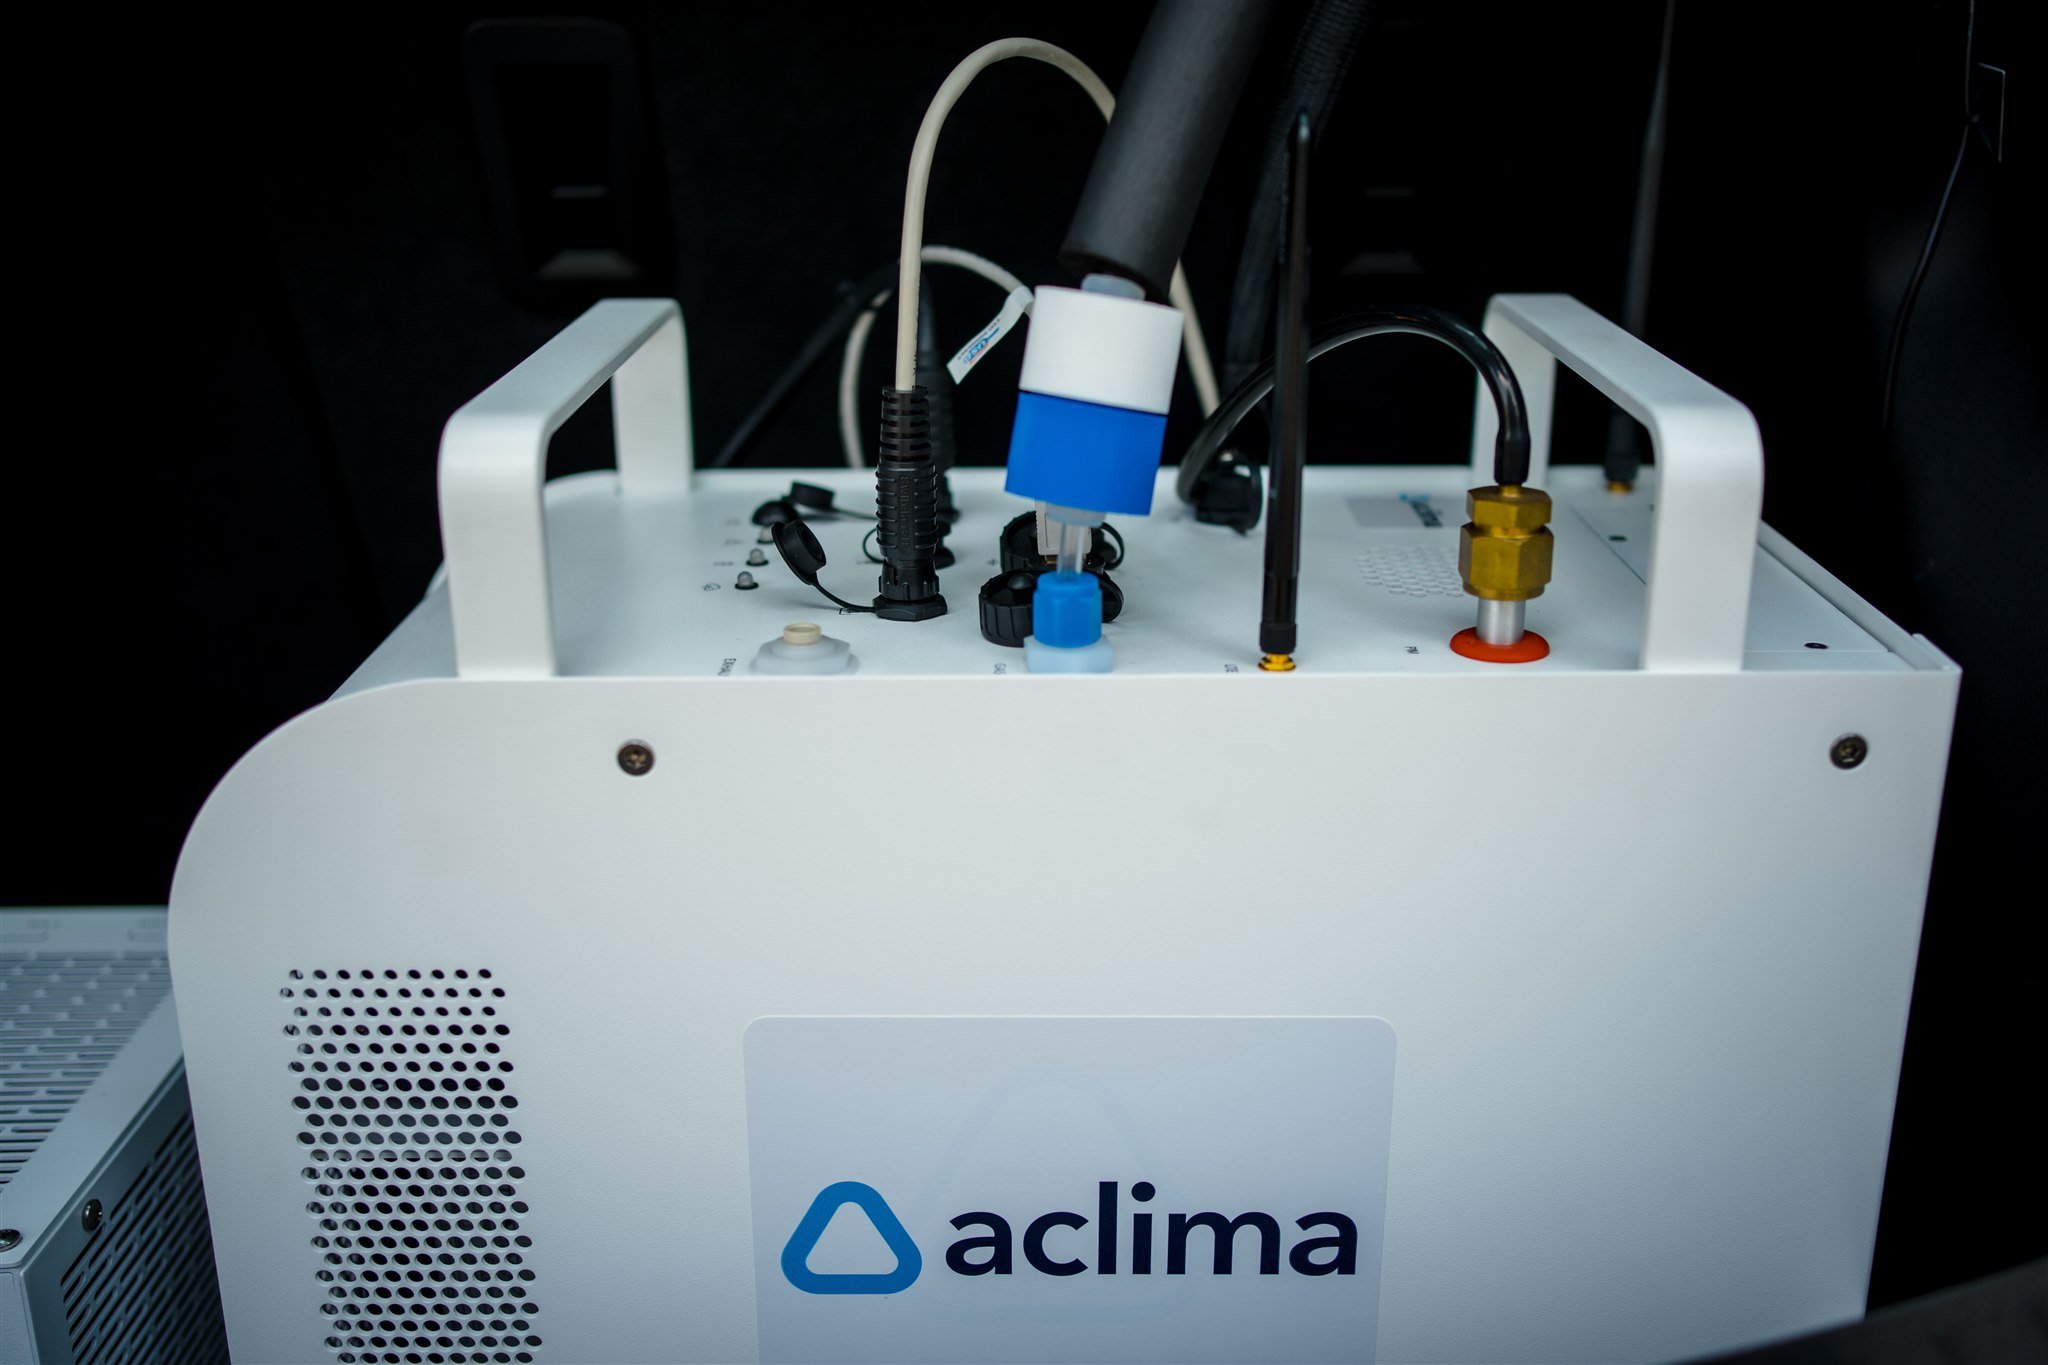
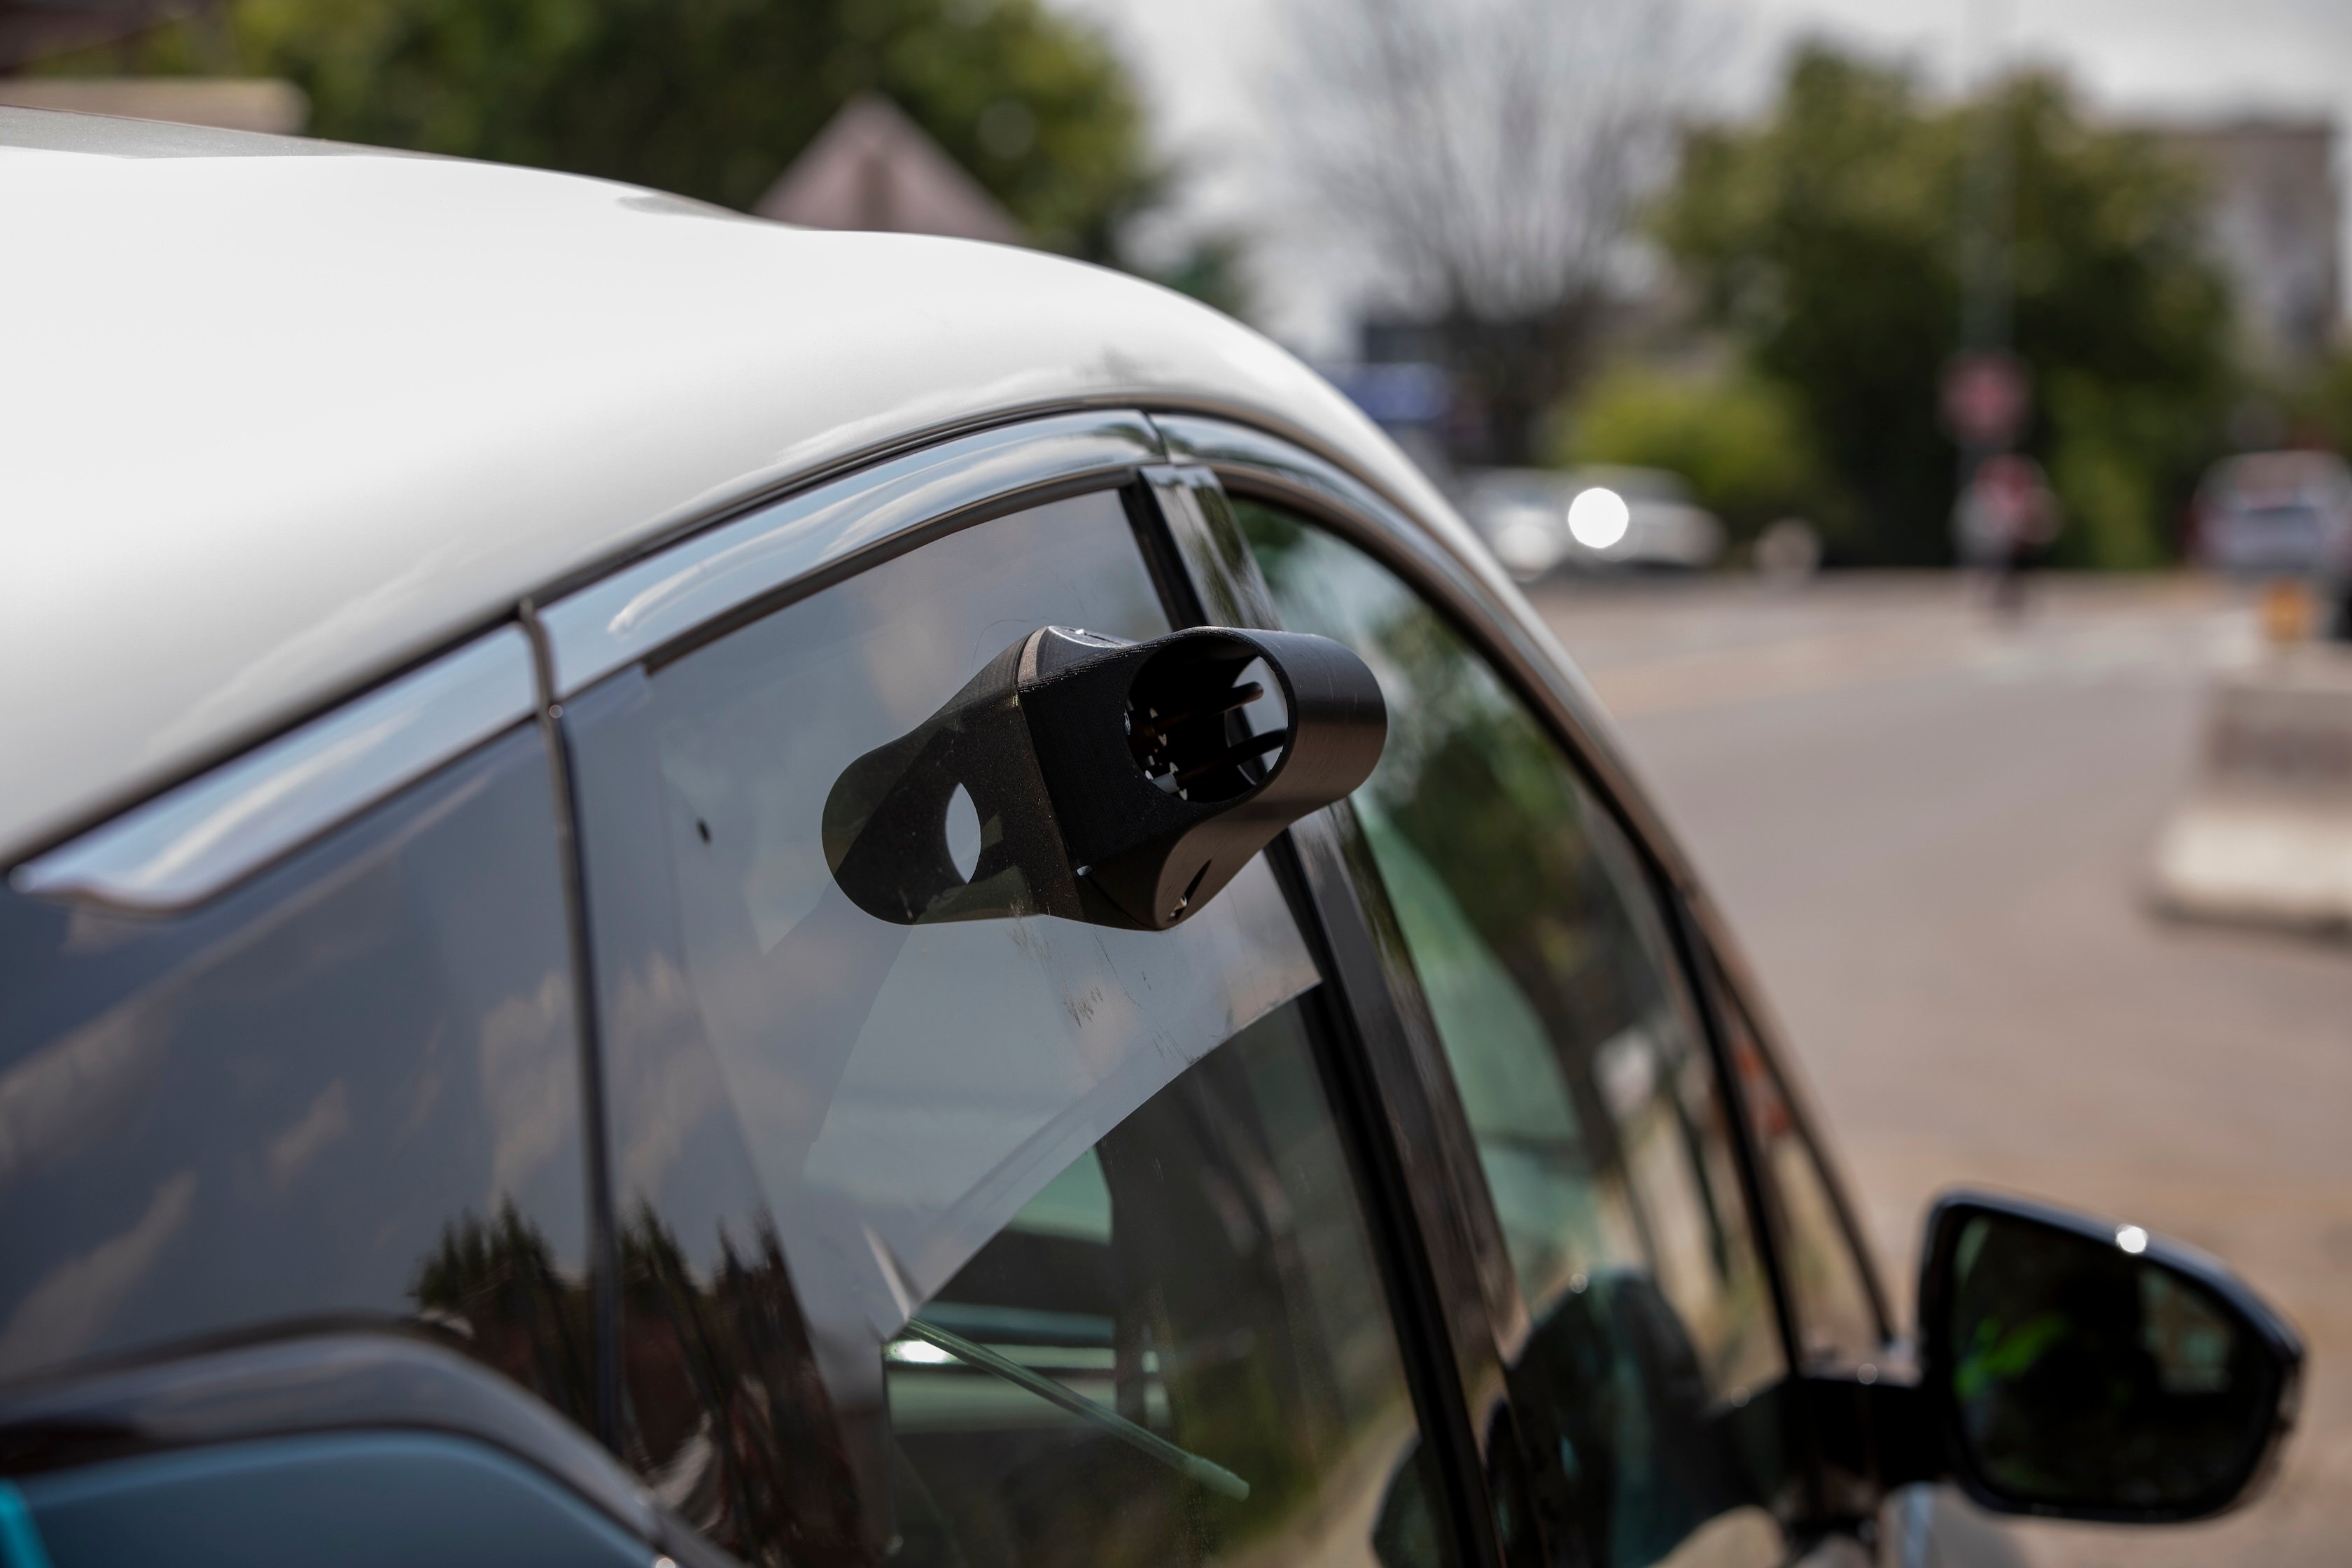
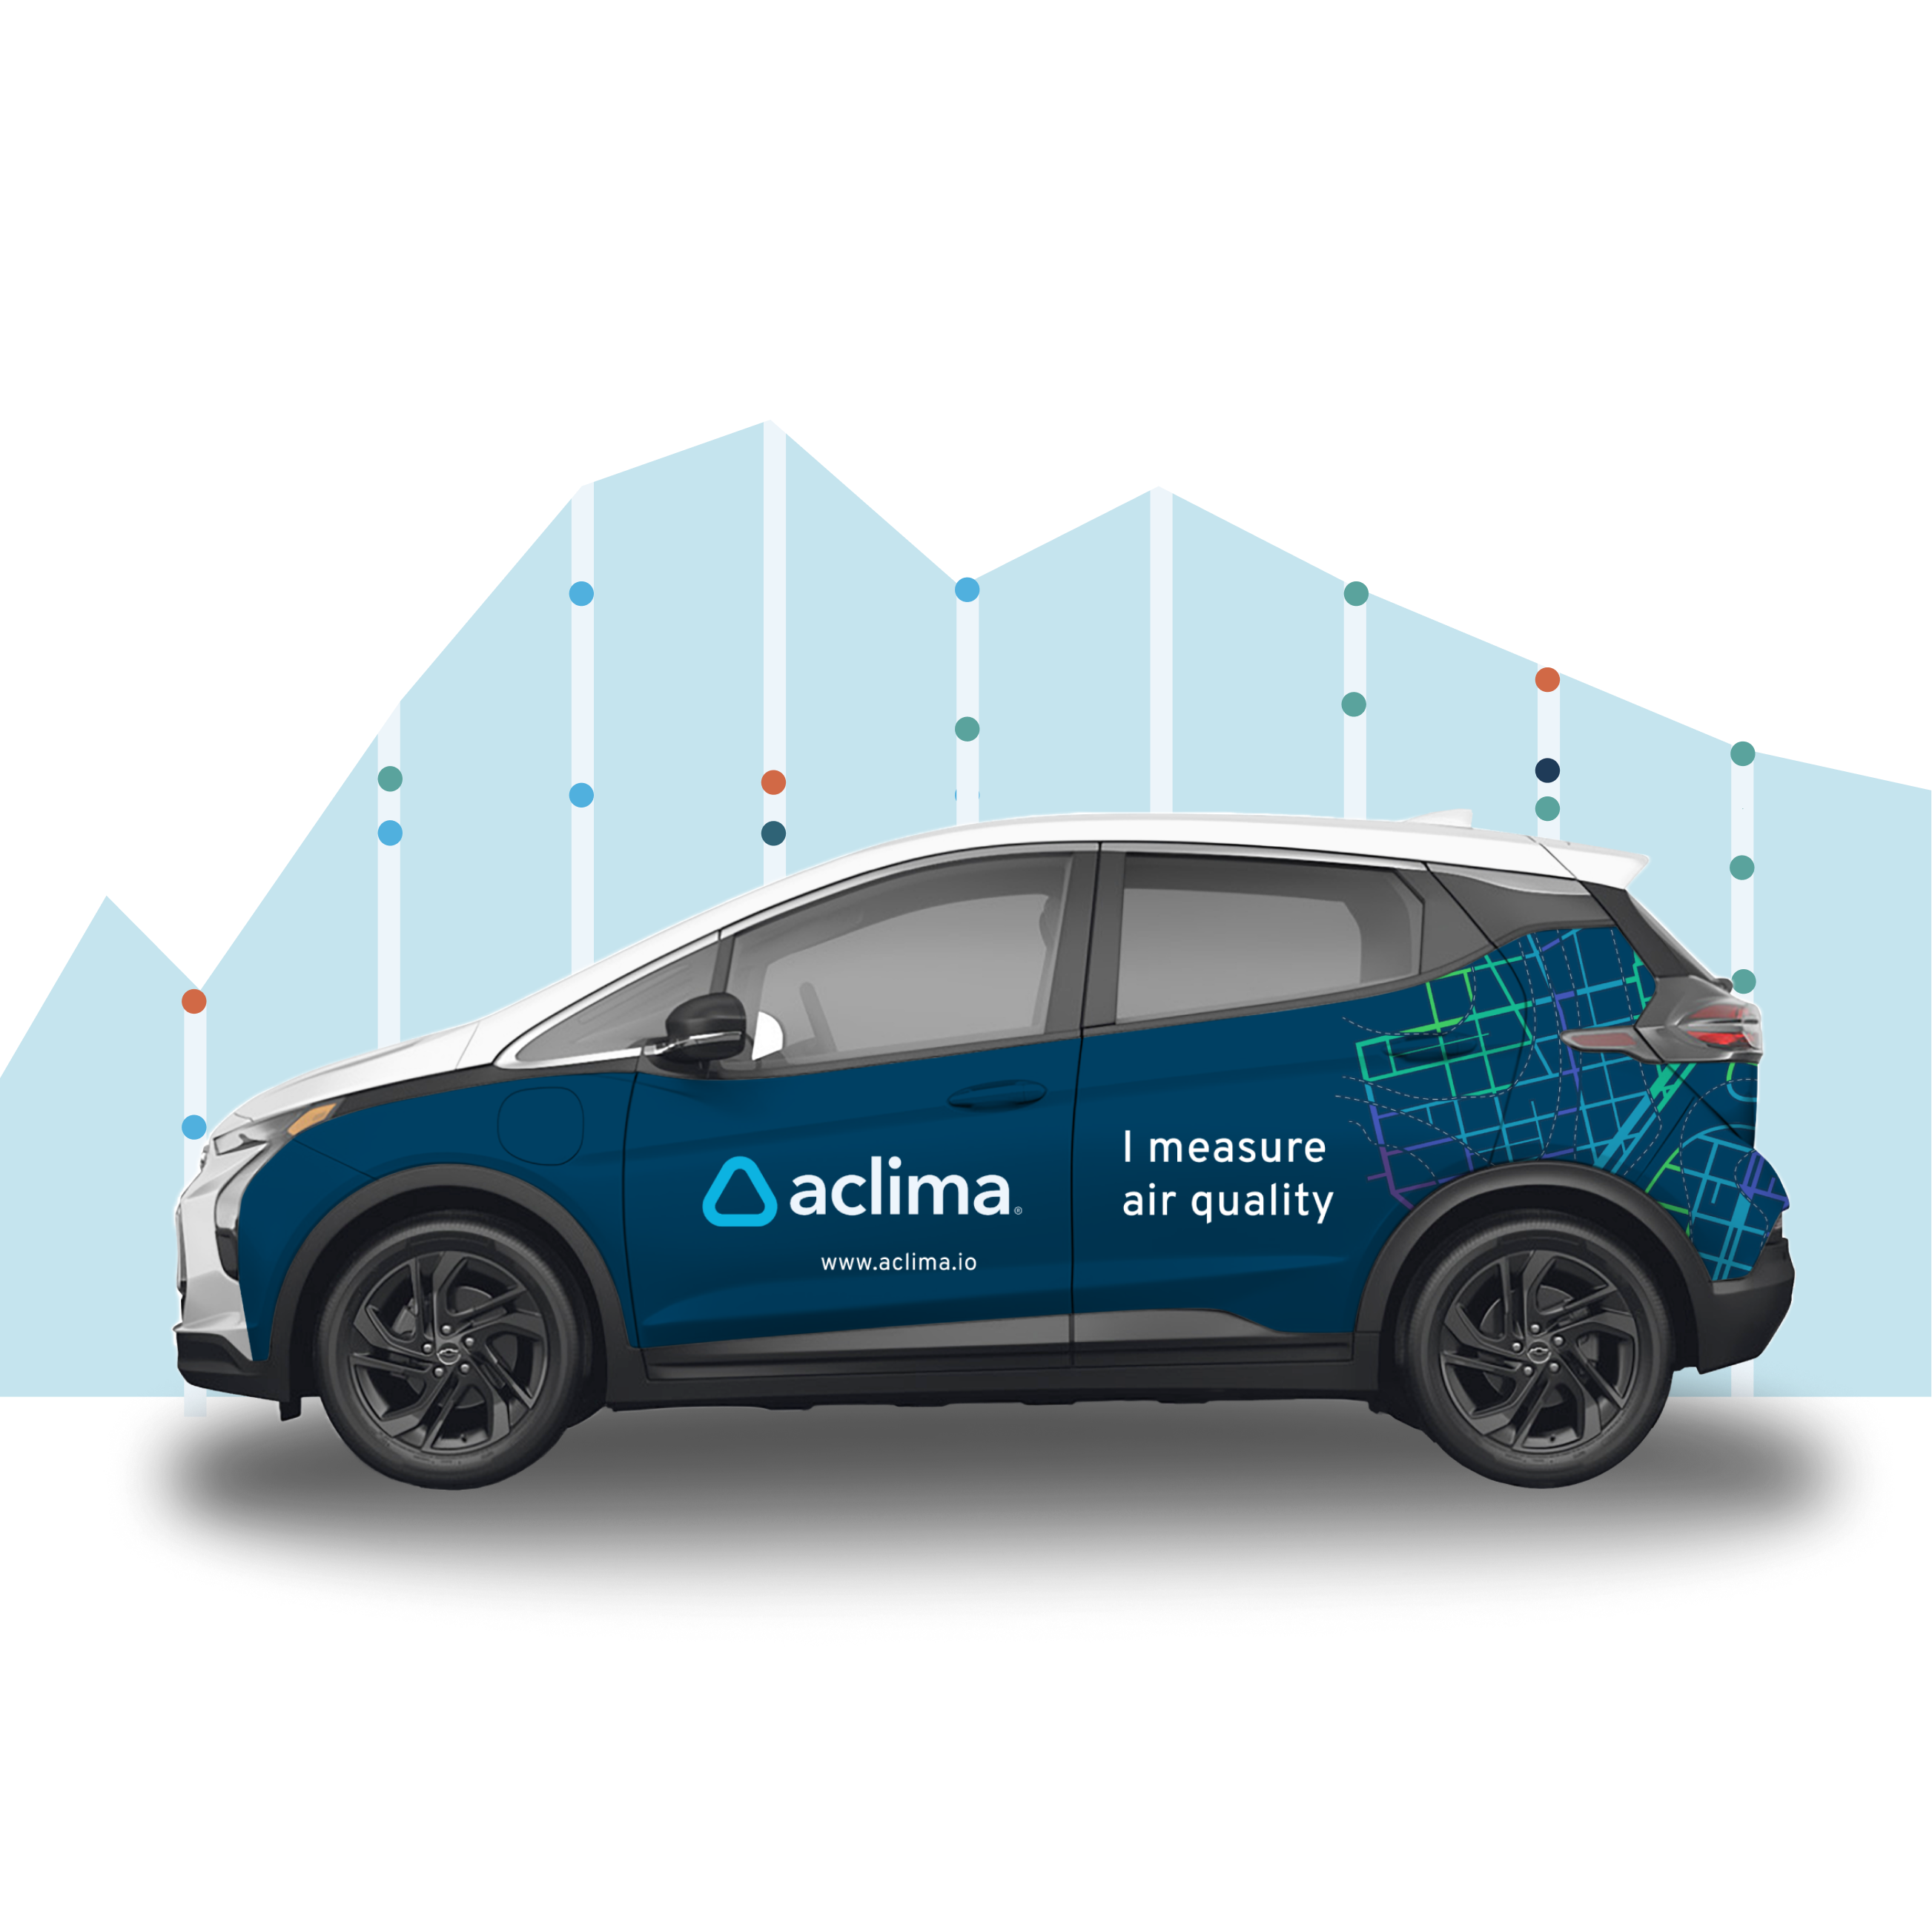
With the Aclima Mobile Node on board, our cars — operated by drivers hired from the local community — drive every public street in the mapping area and collect data every second.
Using the same technology cell phones use to connect to the internet, Aclima’s data are continuously uploaded to the cloud as the car drives.
Multipass, intelligent driving
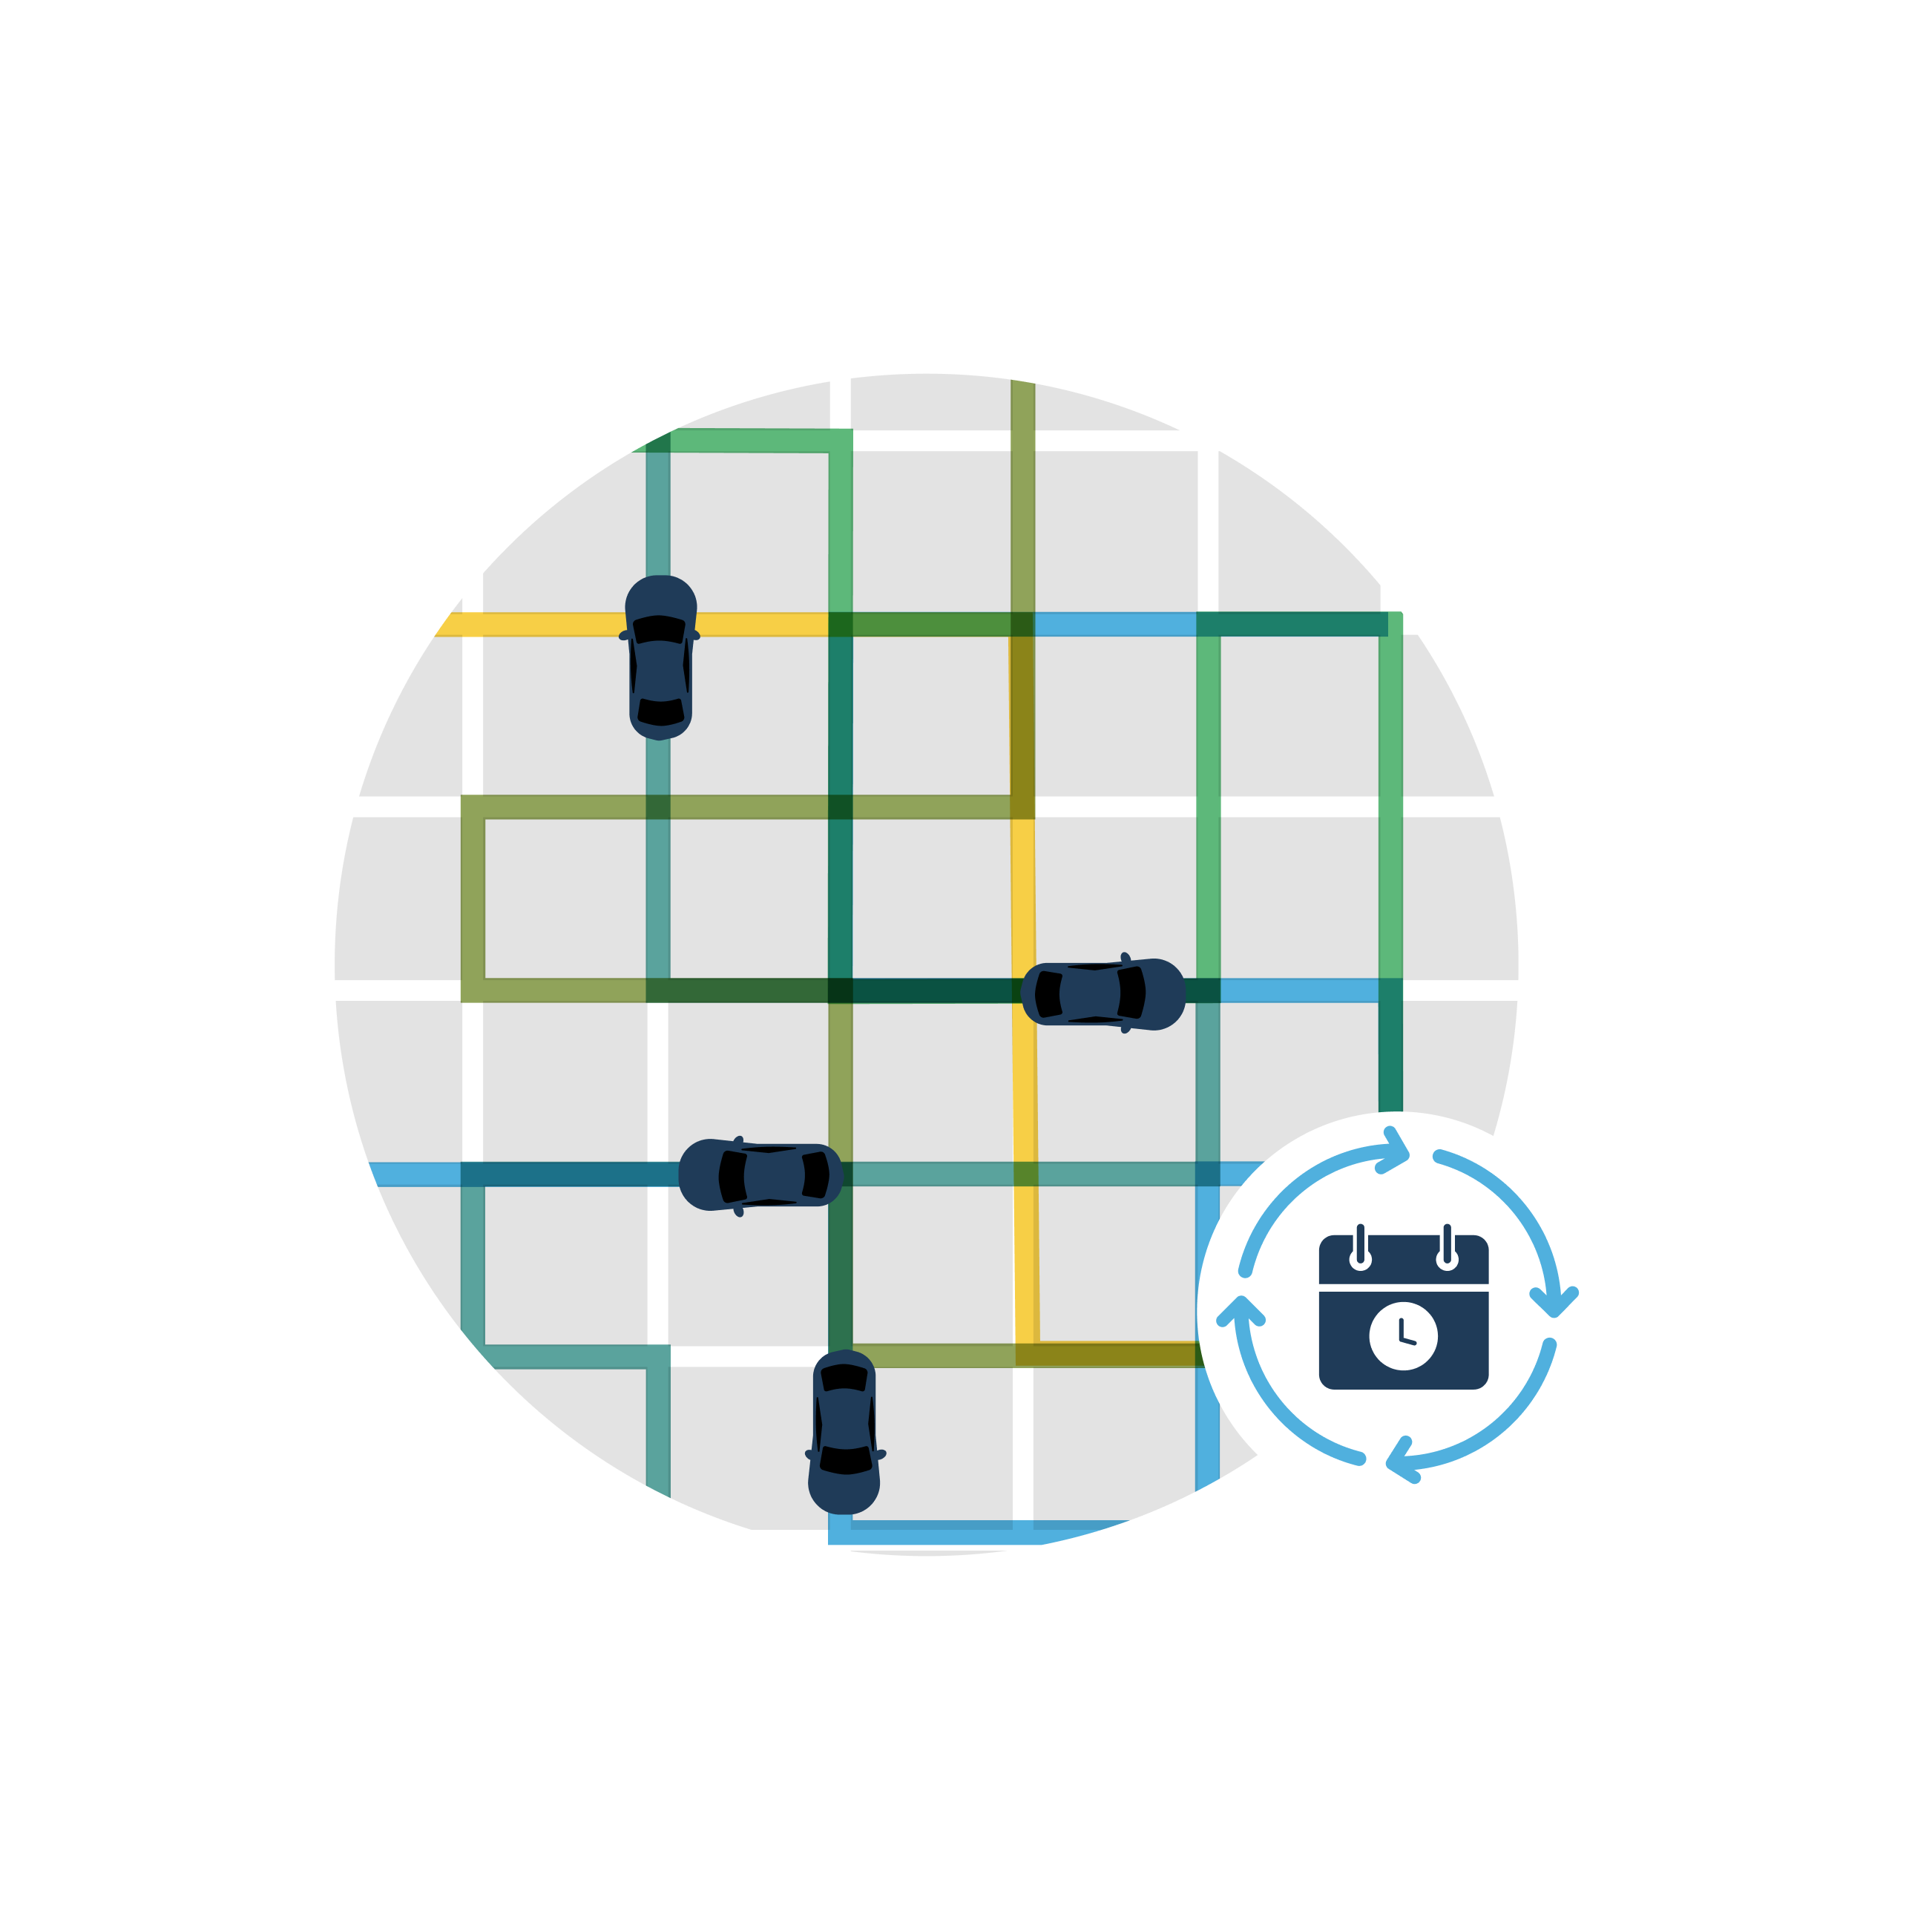
The Aclima fleet drives every road multiple times to collect data at different times of the day, days of the week, and seasons of the year.
Aclima’s intelligent algorithms plan the driving routes, track progress, and adjust to make sure the full area is covered evenly.
Analysis & verification
The Aclima science team pays careful attention to data quality. The AMNs are regularly calibrated and the data checked for things like sensor malfunction or inaccuracies to make sure the final, verified data are as reliable as possible. Aclima compares regulatory station data (when available) to mobile data collected nearby as an additional check.

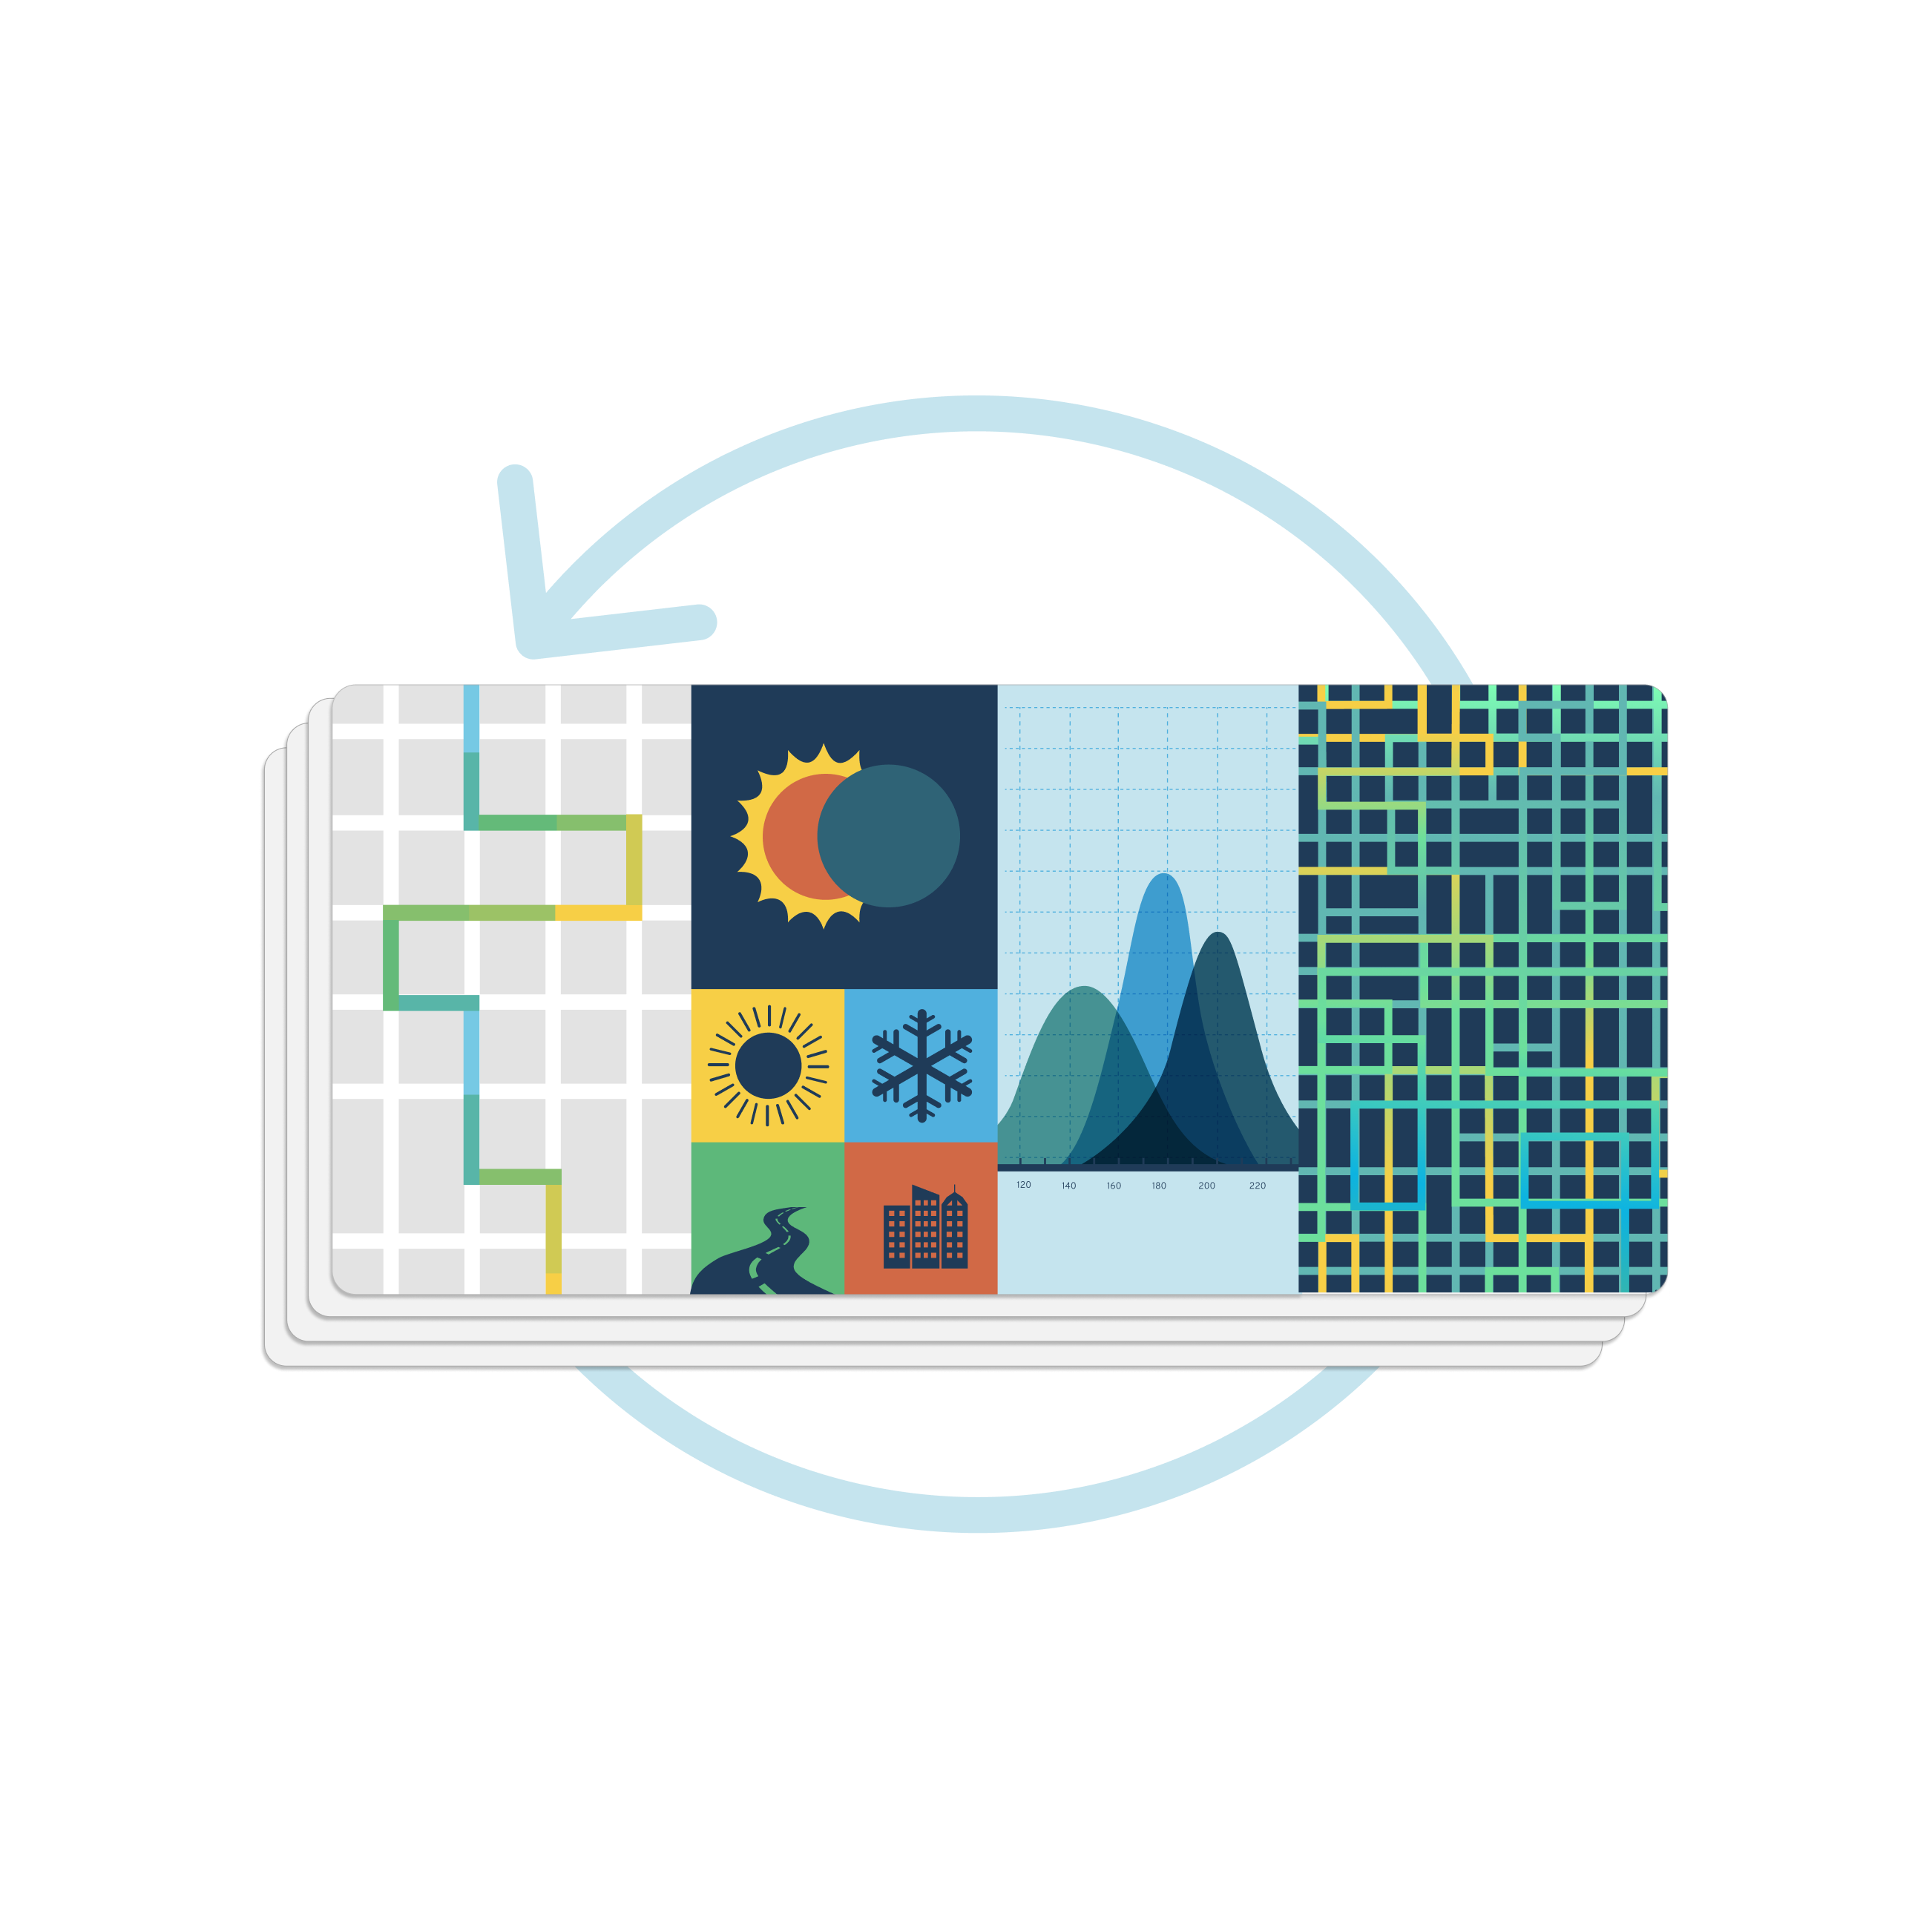
Modeling & calculation
To calculate a single estimate of the annual (or “typical”) average for each pollutant at every location, Aclima feeds the verified data into a statistical model designed by our data science team.
The models combine Aclima’s on-the-ground data with other key information about the area, like road type, weather, and topography. Because blocks are sampled a limited number of times over the year, the model uses statistical methods to fill in the gaps in the on-the-ground dataset. Calculations are carried out for every block in the mapping area, every day of the mapping period. The result is a single annual pollutant average (“typical level”) for each location.
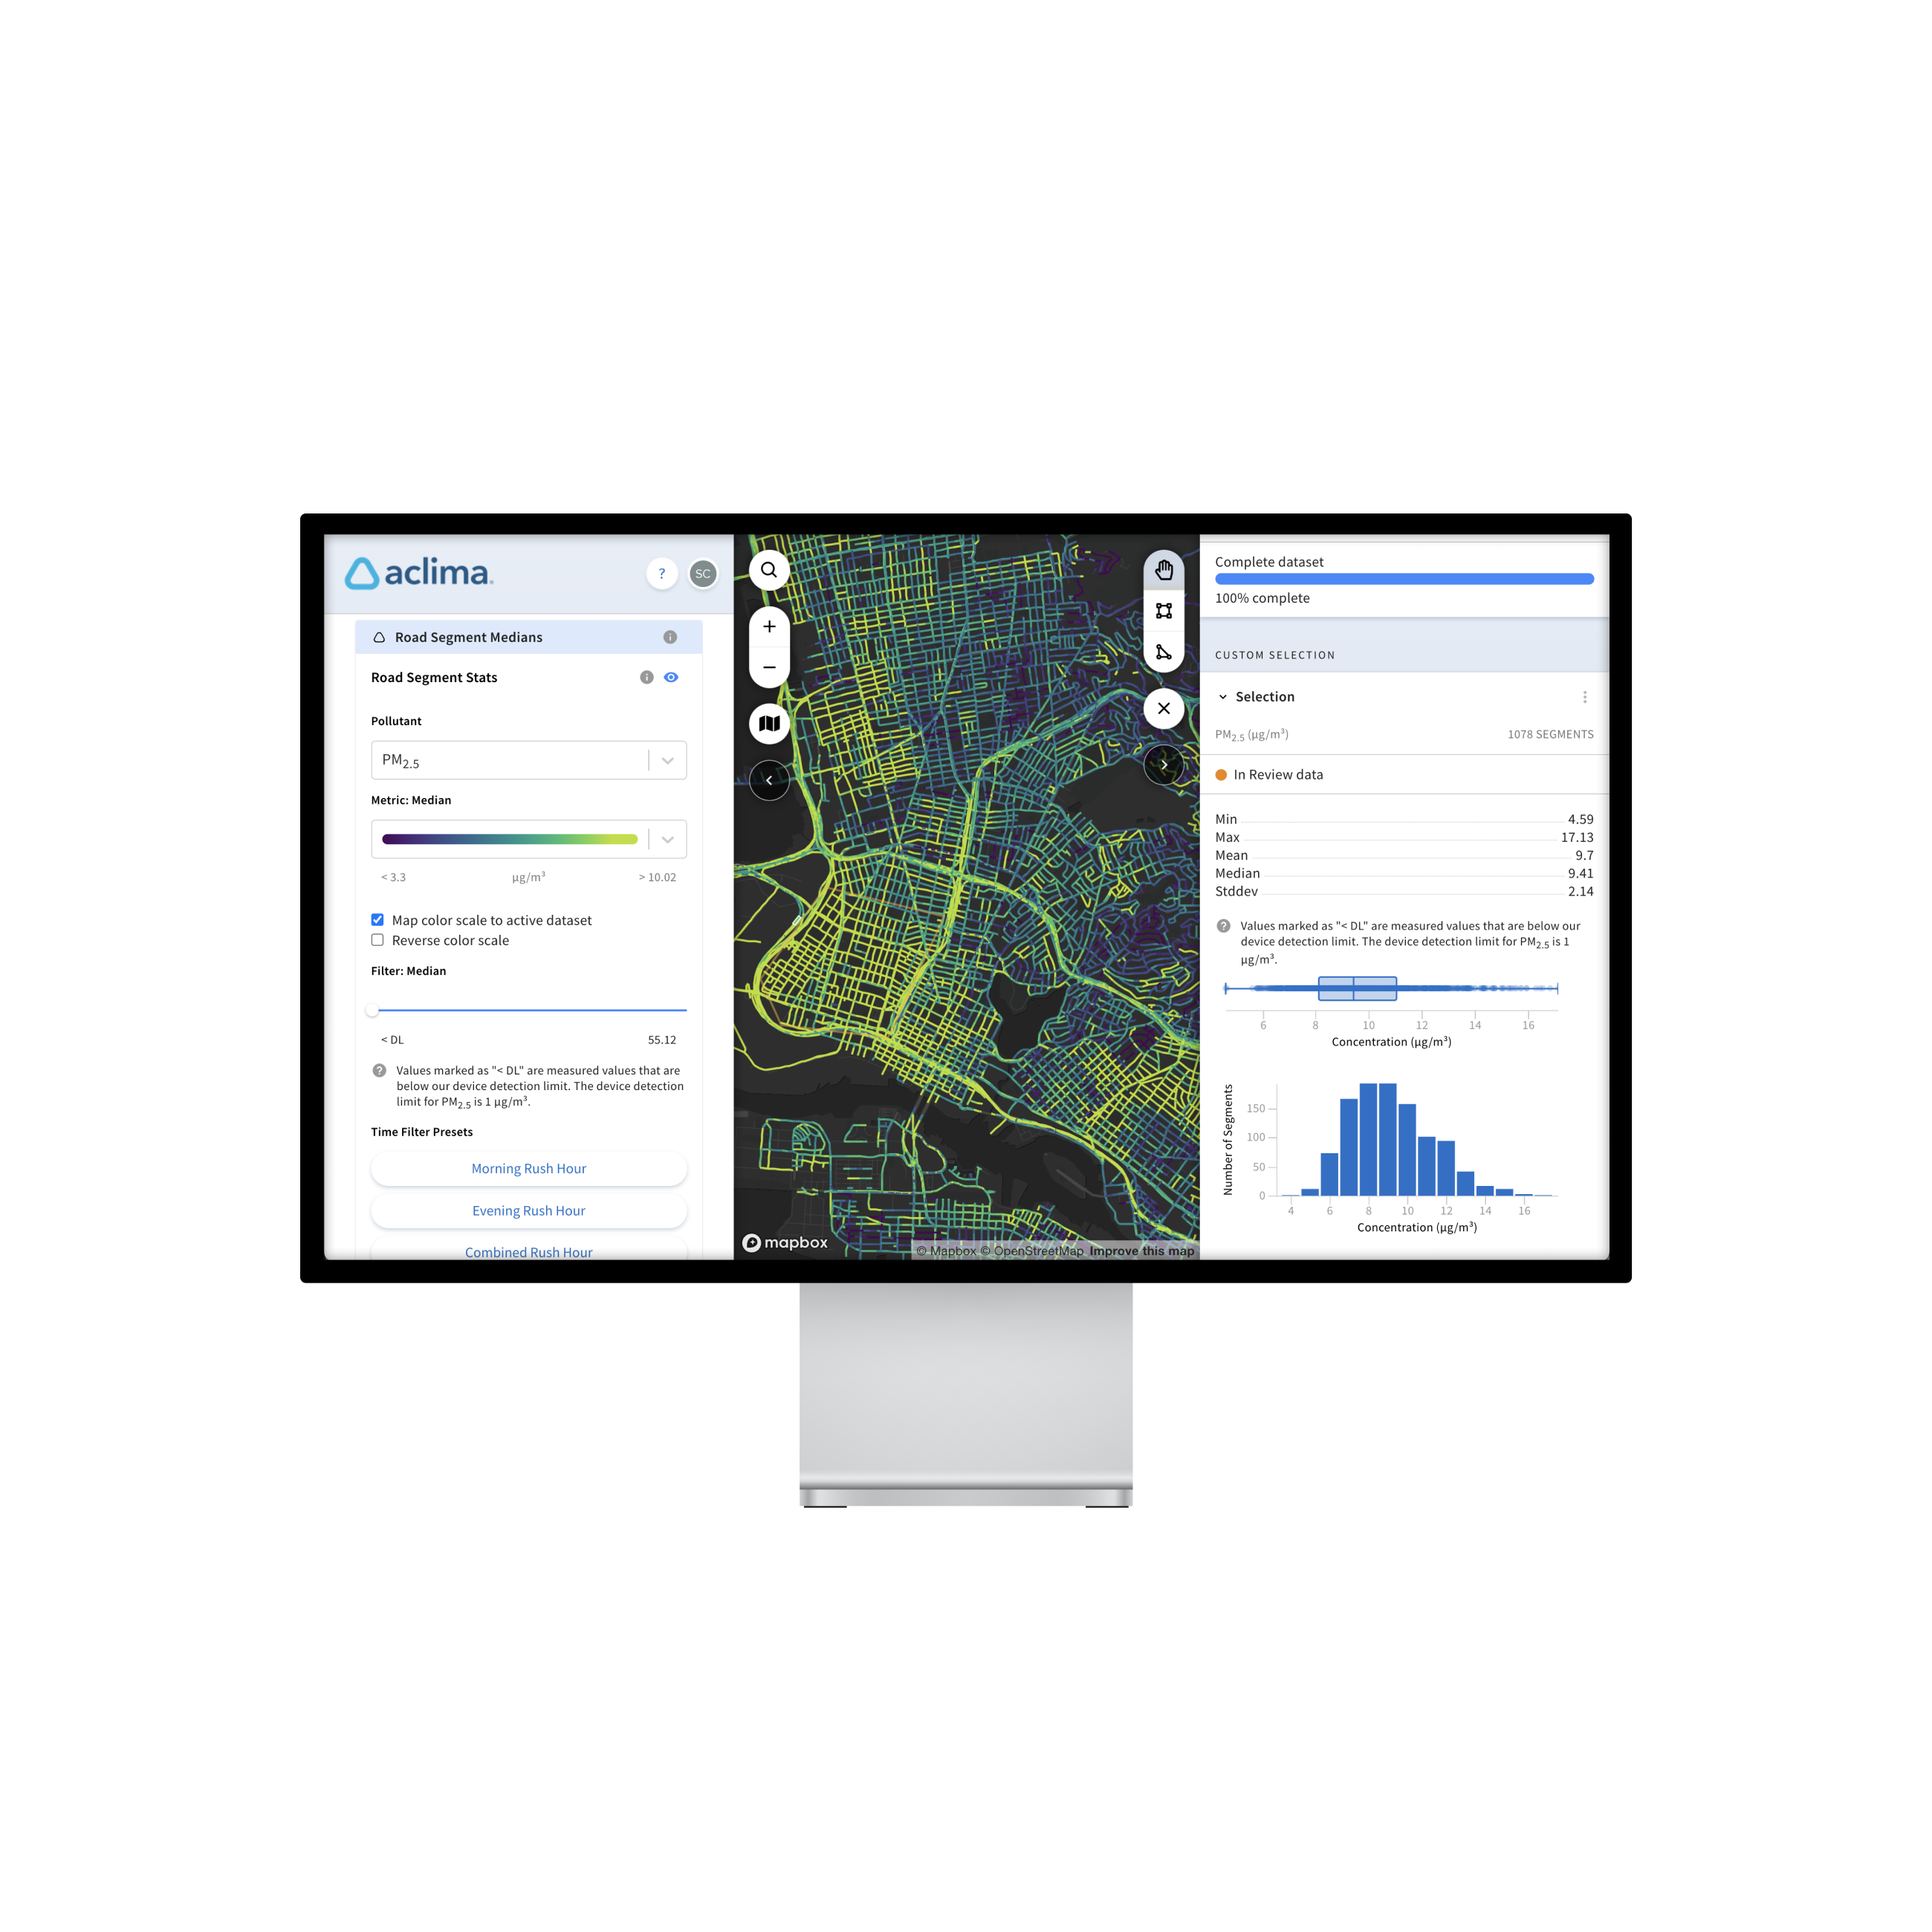
Visualization for action
Aclima’s measurement method results in a lot of data points — about 30,000 for every mile we map.
To help users explore and understand the information (and therefore take steps to improve air quality), Aclima creates interactive maps. The results from the previous modeling and calculation step are what’s shown in the maps.
Aclima Pro, our professional analytics software, is designed for more technical users. Our community portals, like AirNY, are designed for the public.
Aclima’s goal is to help support regulators and communities work together to identify air pollution sources and take clean air action.
Using hyperlocal data
Air quality differs from place to place — New York City and Los Angeles have different air quality overall, but even within those cities, the air quality can change from block to block.
Our maps provide important information about where air pollutant levels are higher and lower within an area, highlighting places where governments and communities can prioritize further investigation or emissions reductions strategies.