Air pollution is a global challenge, often faced most acutely in Asia. The World Health Organization has estimated that 92% of the Asia Pacific population — about 4 billion people — are exposed to levels of air pollution that pose a significant risk to health. India and China are home to some of the world’s most polluted cities where the concentration of particulate matter often reaches hazardous levels; while Thailand recently became the focus of international attention as schools shut down in Bangkok due to toxic air.
This public health crisis is widespread, and Clean Air Asia, an international NGO, is on a mission to improve air quality in cities across Asia. A key step in achieving this goal is measurement to inform the public and key stakeholders on air pollution’s effect on human and environmental health. Unfortunately, this is difficult when sparse, regional and local data can often have limited relevance or actionability for each of us at the personal level. Enter Aclima.
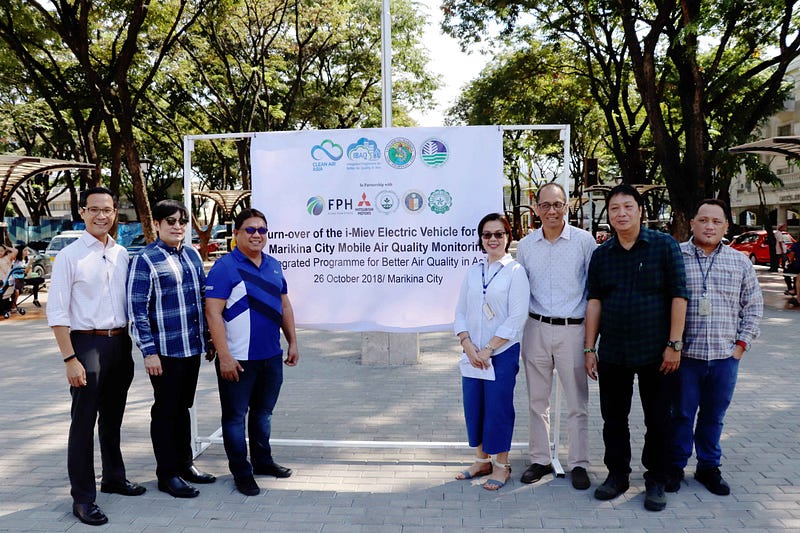
In March 2018, through our partner First Philippine Holdings, Clean Air Asia reached out to Aclima to map hyperlocal air quality in the Philippines, an effort linked to its Integrated Programme for Better Air Quality in Asia (IBAQ Programme). Together, we launched an air quality mapping campaign in Marikina City, a highly urbanized city in Metropolitan Manila, and a Clean Air Asia partner.
With Aclima’s mobile mapping platform, we worked to provide a greater understanding of PM 2.5 pollution exposure for the public, especially commuters, and inform clean air action plans to ease pollution hotspots in Metro Manila. The effort was spearheaded by a consortium of non-profit, commercial, and research groups including Clean Air Asia, Marikina City Environment Management Office, Department of Environment and Natural Resources, First Philippine Holdings, Inc., Mitsubishi Motors Philippines Corporation, UP Institute of Environmental Science and Meteorology, ADMU Environmental Science Department and De La Salle University.
“We believed at first that air quality monitoring is such a simple activity, but we never knew that it can go as extensive as utilizing Aclima’s mobile mapping platform. We were able to identify hotspots within the city, and that will be very crucial in the development or formulation of the Clean Air Action Plan (CAAP). Formulating a CAAP is really not that popular nowadays but it is very important — it’s equally important with all other (city) plans.”
- Ms. Gloria Buenaventura, Head of the Marikina City Environment Management Office
In November 2018, Marikina City and Clean Air Asia presented initial data findings from our mobile mapping campaign conducted from September to November 2018 at Clean Air Asia’s 2018 Better Air Quality Conference in Kuching, Malaysia. The conference is the leading gathering of cities across Asia to share evidenced-based solutions to address air quality issues.
The presentation described the mapping campaign, where an Aclima-enabled vehicle mapped Marikina from September 24th to November 10th. Two different mapping strategies were carried out: one with a set route that included the major roads of Marikina and neighborhoods near the boundary of the city, and another mapped two Barangays (neighborhoods) in the northeast region of the city. From September 24th to October 24th, mapping occurred between 8 a.m. and 5 p.m., typical work hours, and captured pollution due to emissions from businesses and daytime traffic. From October 27th to November 10th, mapping was divided between the hours of 5 a.m. to 8 a.m. and 5 p.m. to 9 p.m. These two time windows capture morning and evening commute times as well as restaurant, home cooking, and other evening sources of pollution. During this part of the campaign, we used an electric vehicle provided by Mitsubishi.
The maps below resulting from the campaign show median PM2.5 concentrations (in 𝜇g/m3) for individual road segments 100m in length. This median value is calculated from all drives of each segment over the course of the study to arrive at a statistically representative map. The results show a wide range in values along the roads and across the city. The highest concentrations, indicated by the brightest red road segments, reflect how localized air pollution hot spots can be. Many of these hot spots occur on major roads in the city.
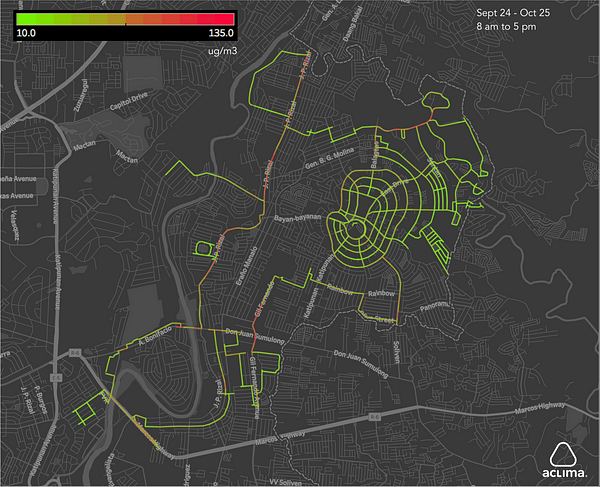
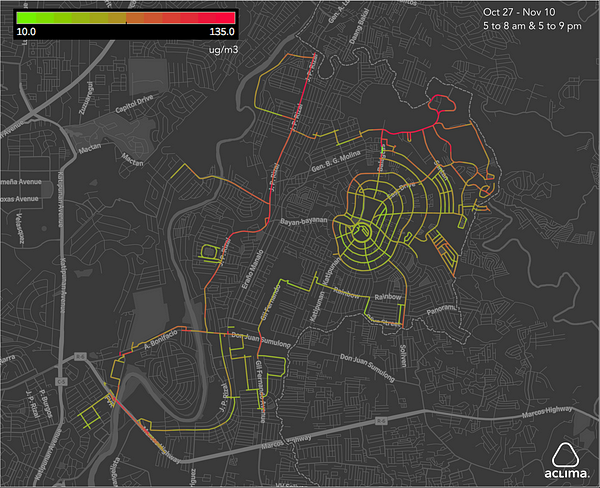
Visual comparison of the two maps shows that, in general, levels measured during the daytime hours (8 a.m. to 5 p.m.) are lower than those measured during the early morning and evening time periods. The map for this time period simply looks redder overall. PM2.5 concentrations measured during daytime hours ranged from 21 to 108 𝜇g/m3, while those measured in morning and evening varied from 32 to 230 𝜇g/m3. The average concentration for the morning and evening hours was 66 𝜇g/m3, a significant difference compared to the daytime value of 44 𝜇g/m3.
The maps demonstrate the power of Aclima’s platform to reveal how varied air pollution can be across a city, one block to the next, and at different times of day. It also proves to be effective at identifying pollution sources. Both of the maps show patterns in the distribution of pollutant concentrations that reflect nearby sources. The differences between the two time periods can help understand when emissions from these sources are highest, and can help distinguish between sources based on how their emissions are expected to vary with time.
With Aclima’s unique block-by-block air quality mapping and visualization tools, Clean Air Asia and the local community were able to identify significant emission sources using their local knowledge of the city. These hyperlocal air quality reports have led to a better understanding of exposure to residents and commuters, and are being used to develop the city’s Clean Air Action Plan to reduce air pollution hotspots, such as “no car zones” in school or recreation areas. Combining our measurements of the physical environment with contextual local knowledge gives communities a richer picture of air quality issues in their region.
We’re excited to return to Marikina, and continue supporting Clean Air Asia with their work in the Philippines and throughout Asia, as our partnership expands. The flexibility of our platform and the insights it provides are essential new tools for air quality management and pollution reduction. With every new community using our platform, we make meaningful progress towards improving the health of our environment and our communities.
To find out how we can support your city or your community, get in touch at communities@aclima.io.
Share this
Driving Science
Healthier Cities Through Data