Early Tuesday morning in San Francisco, a massive five-alarm fire erupted in a building supply company according to the San Francisco Fire Department (SFFD). Smoke from the fire rose in a plume high above ground level and was blown northeastward by the winds aloft. Aclima’s network of mobile and stationary air quality sensors picked up the local spikes in fine particulate matter (PM₂.₅) in the hours after the fire began. We continued to see elevated PM₂.₅ levels — particularly in the East Bay — until the valiant and commendable people of the SFFD all but extinguished it midday. However, firefighters remain on the scene as the debris continues to burn.
Aclima Reports Elevated Real-Time PM₂.₅ Levels in West Oakland After Fire in San Francisco
Aclima makes street-level and real-time hyperlocal air quality data for West Oakland available to the community at insights.aclima.io/west-oakland. You can see in the chart below that PM₂.₅ levels measured by two of our stationary air quality sensors in West Oakland showed a large spike at about 8:00 a.m. after the five-alarm fire started burning across the bay in San Francisco at around 6:30 a.m.
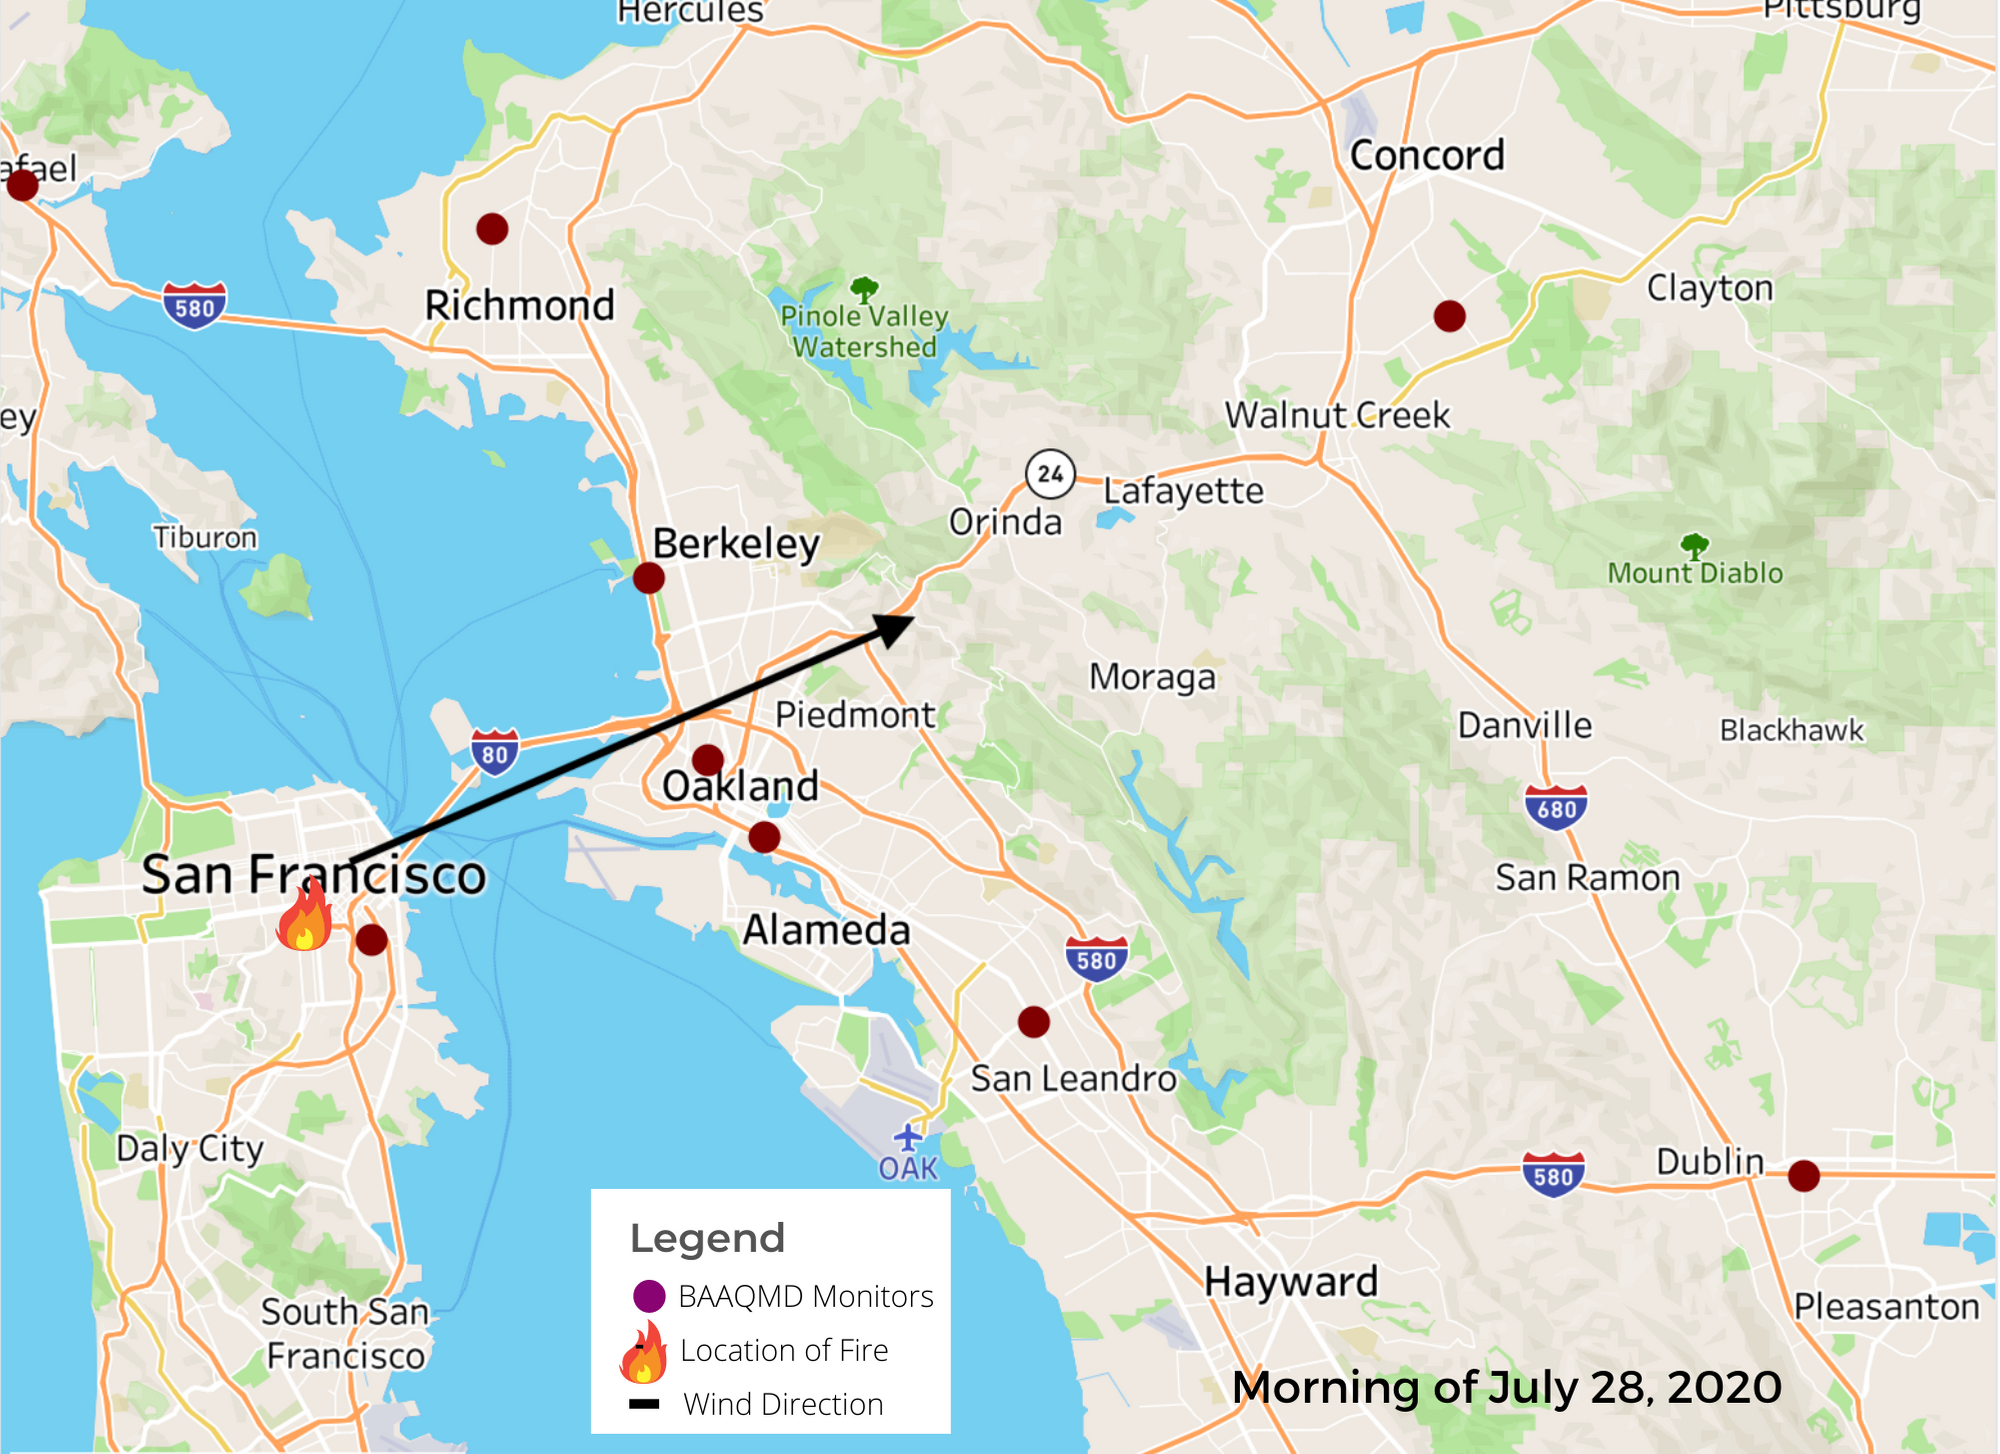
During the timeframe of the blaze, the wind above ground level was predominantly blowing to the northwest. By late morning, the fire was 90% contained and the plume of fire emissions was greatly reduced. The containment of the fire and reduced emissions are reflected in the gradual decline of PM₂.₅ levels in West Oakland shown above Tuesday afternoon as the smoke was blown to the east and out of the area. You can see the location of stationary monitors and sensors, and the wind direction the morning of July 28, 2020 in the maps below.
Regulatory monitors throughout the East Bay showed increased PM₂.₅ After Fire
Looking at data from regulatory monitors in West Oakland, East Oakland, San Pablo, Concord, and Pleasanton, there were notable increases in PM₂.₅ on Tuesday mid-to-late morning. The peak concentrations in Concord and Pleasanton were observed around 2 hours after those seen in Oakland, reflecting the longer time for the fire emissions to reach those locations and at lower concentrations due to dispersion of the plume with distance. Interestingly, monitors in Berkeley and San Pablo, just a few miles north of Oakland, did not report increased PM₂.₅ levels. While that regulatory monitor in San Francisco is located about a mile west and slightly south of the fire, the increase in PM₂.₅ measured at that location was significantly smaller and delayed compared to the monitors in the East Bay. Initially, the plume of smoke rose high in the atmosphere, where it was blown to the northwest. As the fire was contained, the smoke stayed closer to ground level, moving west through San Francisco. Meteorology plays a significant role in how pollutants like emissions from events like this fire can have very different impacts at the regional and local scales.
Comparing PM2₂.₅ Levels in West Oakland Tuesday to Recent Levels
Using our interactive reporting tool at insights.aclima.io/west-oakland, we can compare PM₂.₅ levels Tuesday to the past week, month, and 90-days.
For example, one of our stationary monitors at the Saint Vincent Day Home reported a sizable 3-hour and 53-minute spike in PM₂.₅ above WHO recommended levels after the fire started in San Francisco, and the smoke was transported across the Bay to West Oakland. The levels of PM₂.₅ measured Tuesday were more than 20 times higher than the average for the past week at that location, which was 4.3 micrograms per cubic meter (µg/m3), as you can see in the figure below, or by going to the website, looking up Saint Vincent Day Home, and selecting Last Week in the Real-Time Air Pollution Data section.
When There’s Smoke, Check PM₂.₅ Levels and Protect Yourself
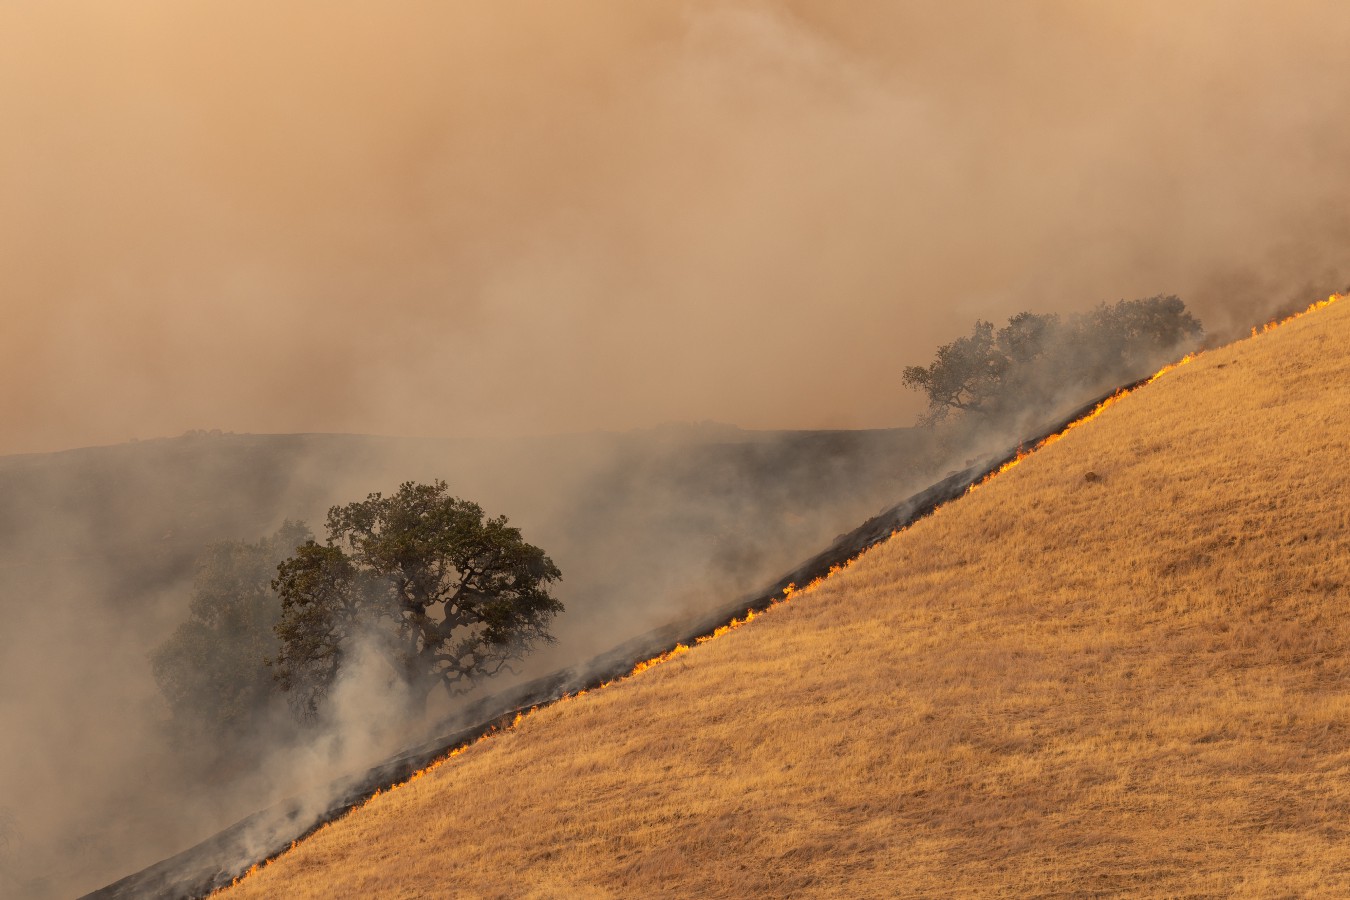
Particulate matter from smoke poses health risks. These particles are often invisible and can easily enter the respiratory system and eyes, causing irritation of the eyes, nose, and throat, as well as respiratory illnesses such as bronchitis. Also, fine particulate matter can aggravate chronic heart disease, and lung diseases, and can exacerbate asthma.
When fires create smoky conditions, it is important to remain indoors to reduce your exposure to smoke. This is especially important for children, older adults, and people with pre-existing lung and heart diseases.
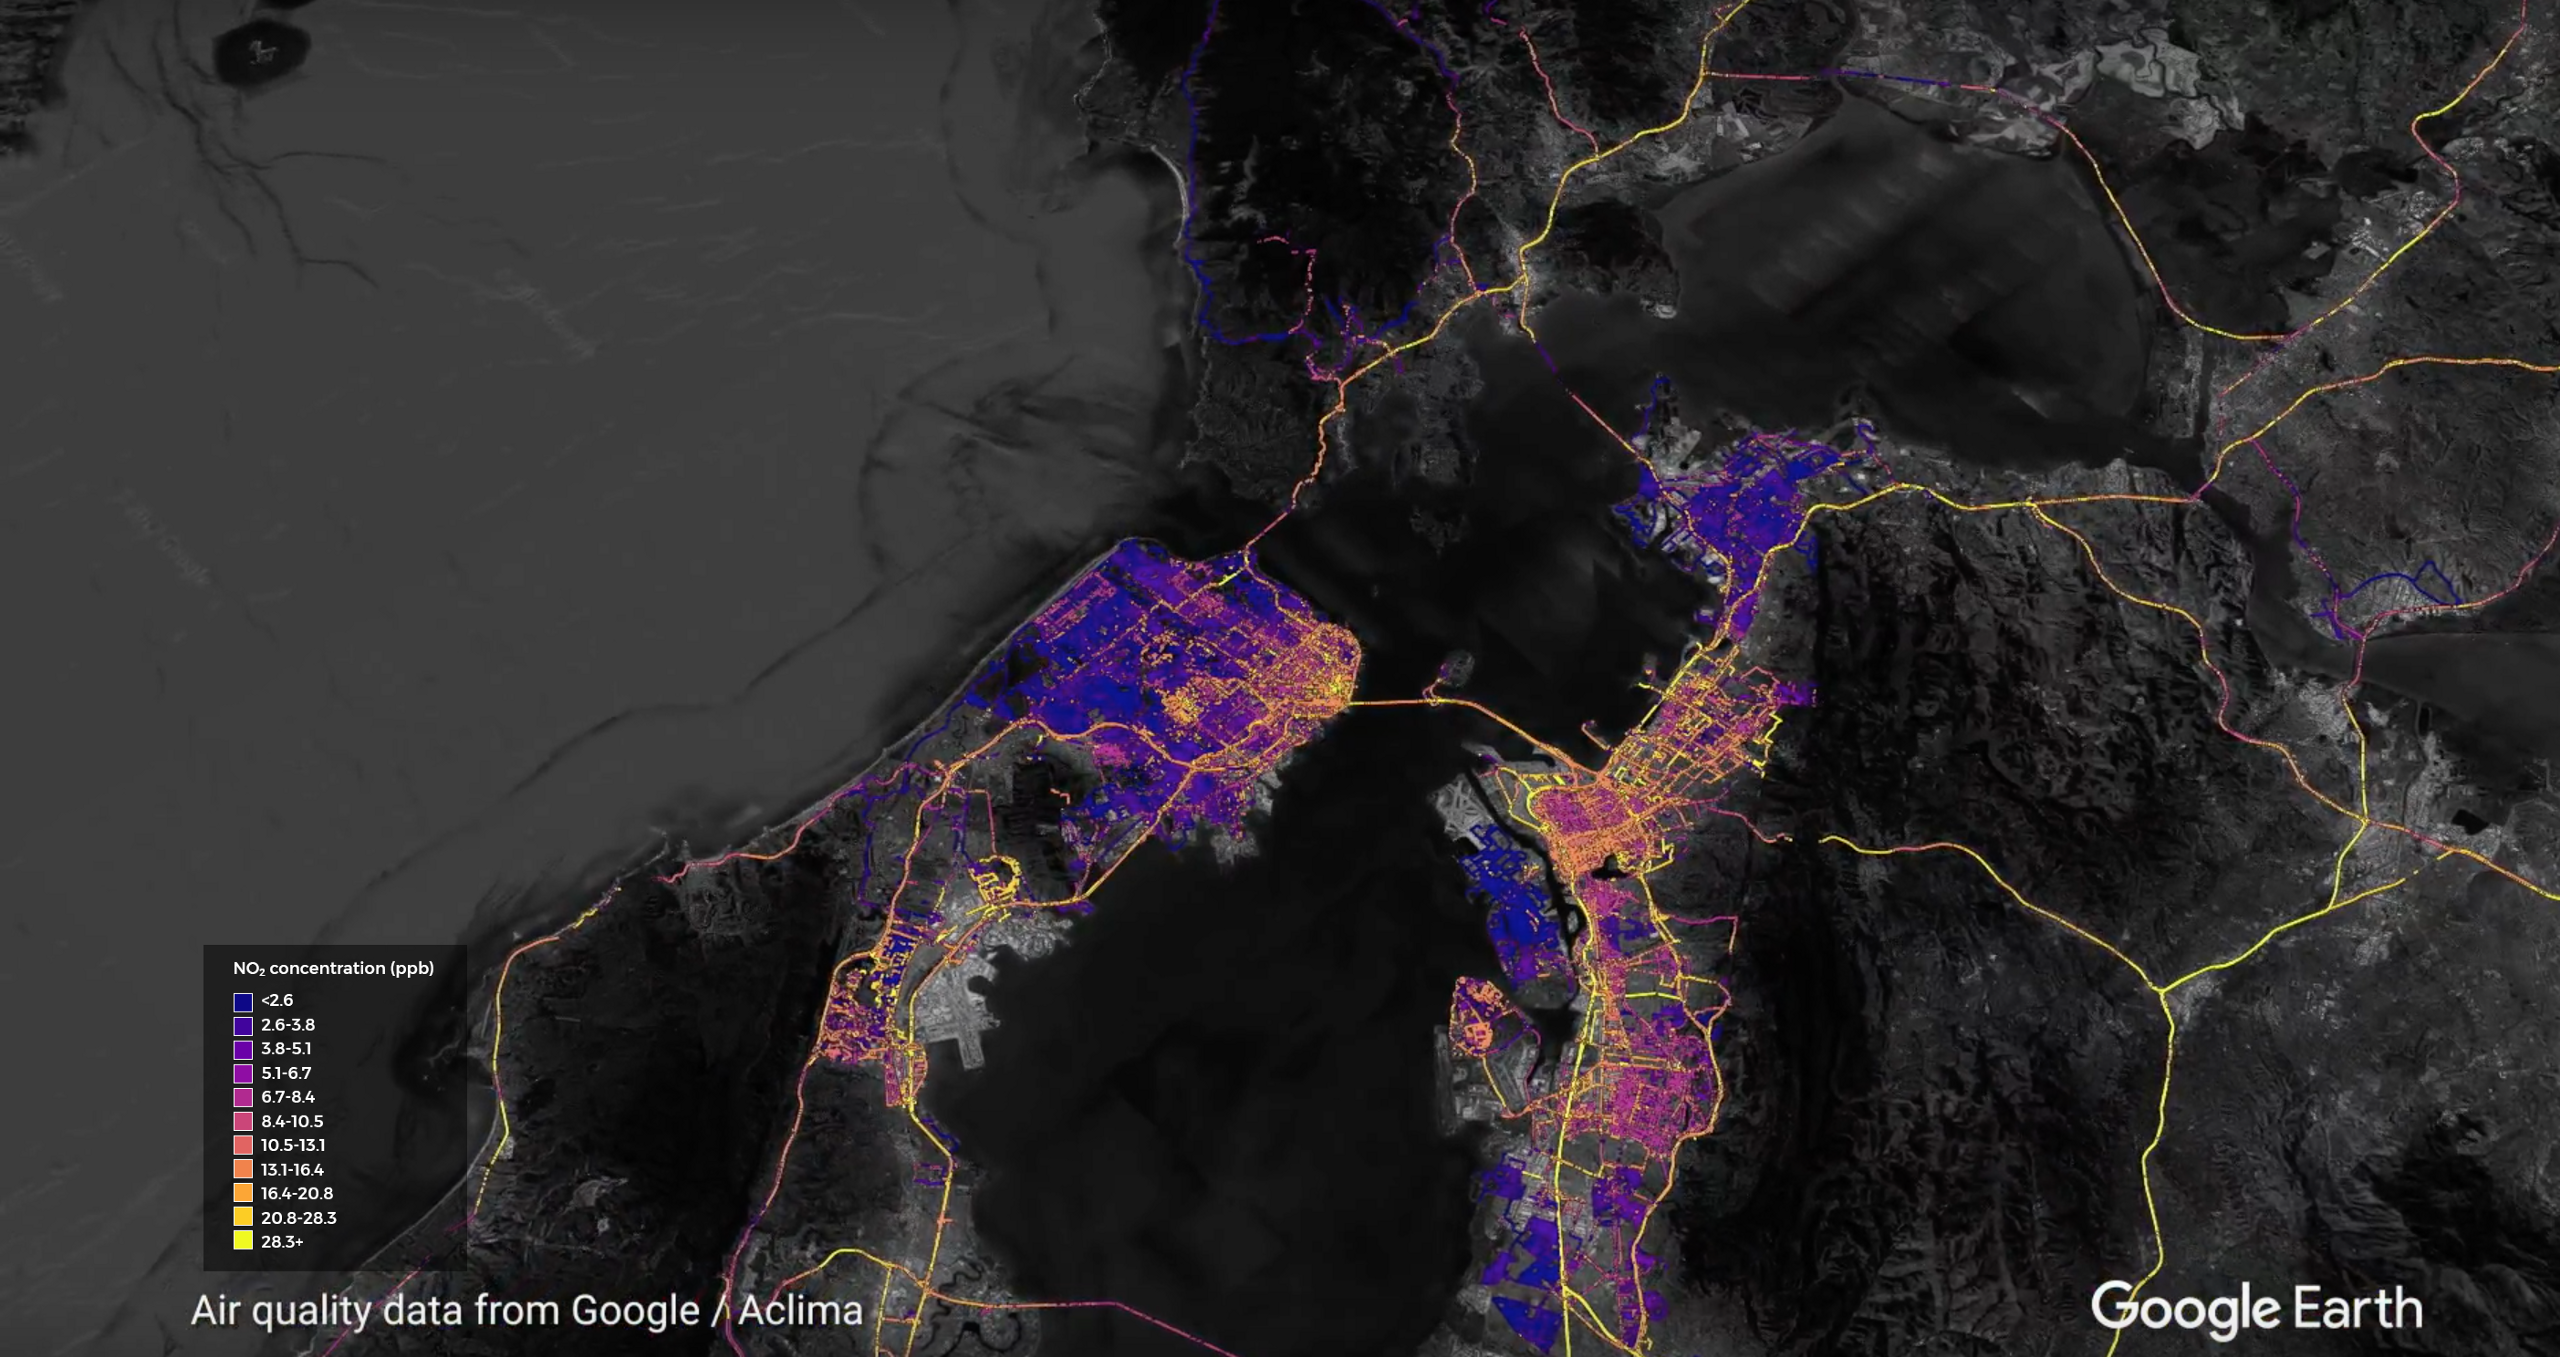
The aim of Aclima’s air quality measurement network is to capture air quality where people live, work, and spend time with their families. Aclima’s fleet of sensor-integrated vehicles is mapping air pollutants and greenhouse gases block-by-block throughout the Bay Area to protect human health and the environment — covering more than 5,000 square miles.
Share this
California Air Quality During Lightning Complex Fires
Sensing Wildfire Smoke at the Street Level