Looking at two neighborhoods in a city, we see a common theme that may seem like common sense: busy streets produce more pollution. But we also see how freeway overpasses, busy intersections, and stop-and-go traffic on streets can contribute to pollution spikes.
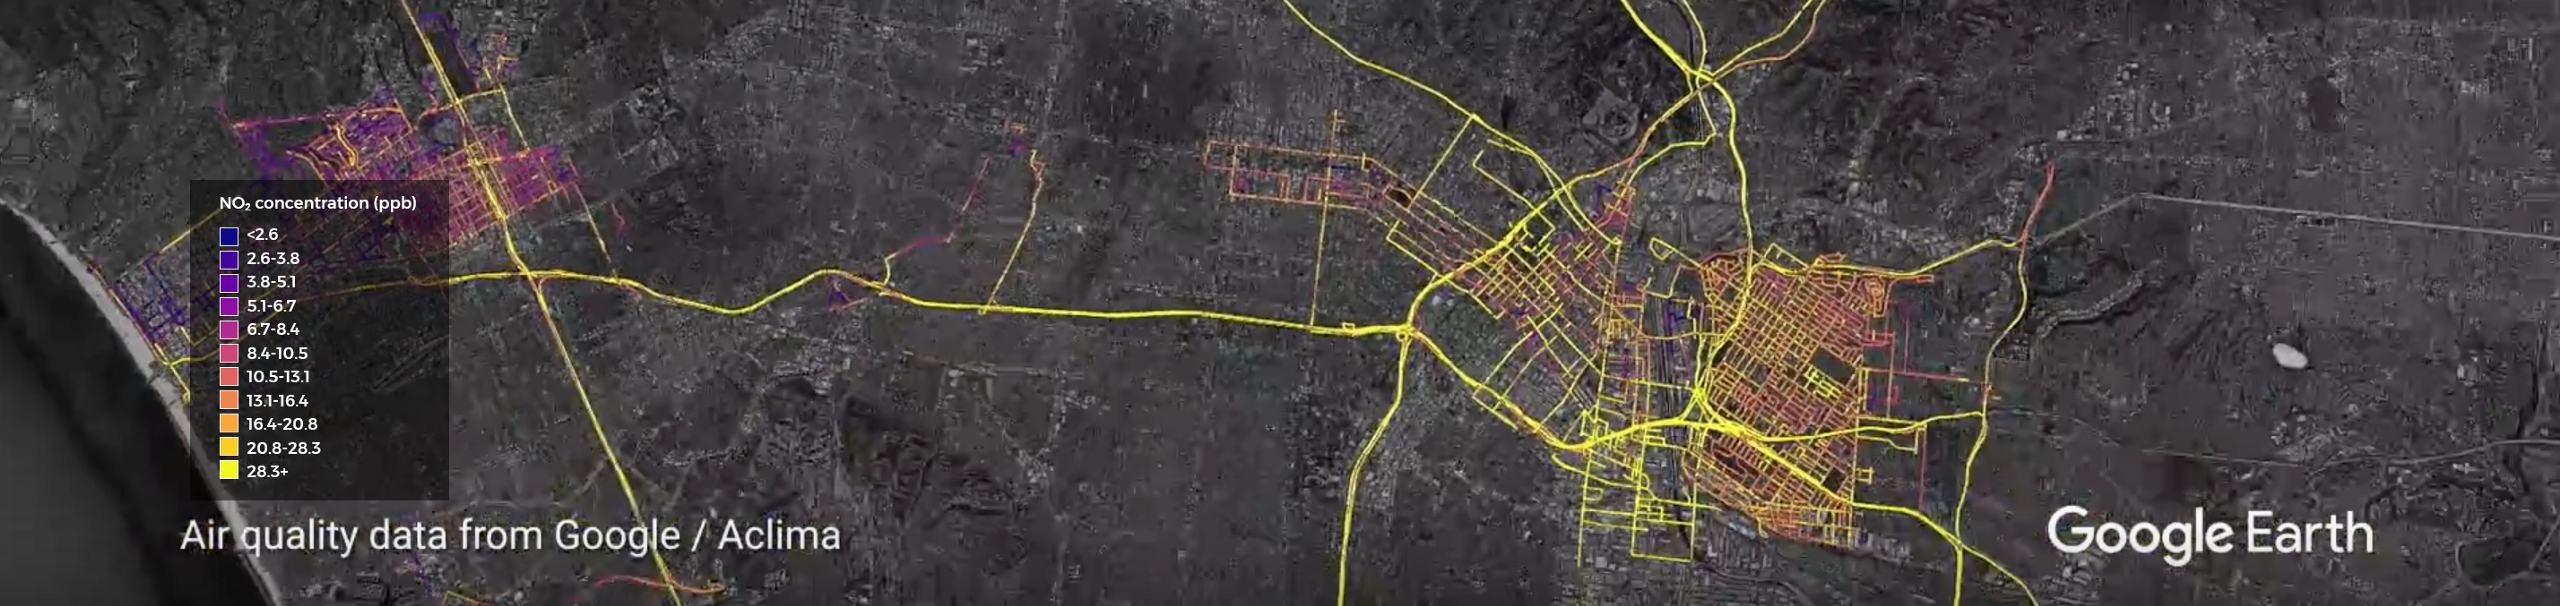
A recent study found that the concentration of airborne nanoparticles at red traffic lights are as much as 29 times higher than concentrations seen while the car is cruising. One study found that pollution levels inside cars due to congested traffic around intersections are up to 40 percent higher than when traffic is moving. Exposure to ultrafine particles, particles with a diameter of less than 100 nm, from motor vehicle emissions is a particular health concern, Using Aclima’s mobile platform, we can look at the variability in how pollution varies along individual streets at a hyperlocal level as our sensor-equipped Google Street View cars drove down them.
What We Found
On September 26th, we drove down major thoroughfares in two neighborhoods of Los Angeles — Wilshire Boulevard in West Los Angeles and Cesar Chavez Avenue in Boyle Heights. The graphic below shows how the concentration of nitrogen dioxide (NO2) changed as we drove down each street in the late morning. The numbers 10 and 11 on the left hand side represent the average concentration of NO2 as measured by the closest regulatory monitoring station. For both Wilshire Boulevard and Cesar Chavez Avenue, the NO2 levels at street level were above this regionally representative measurement during this time period. We found that the concentration of NO2 increased when cars moved forward after being stopped at the indicated traffic lights.
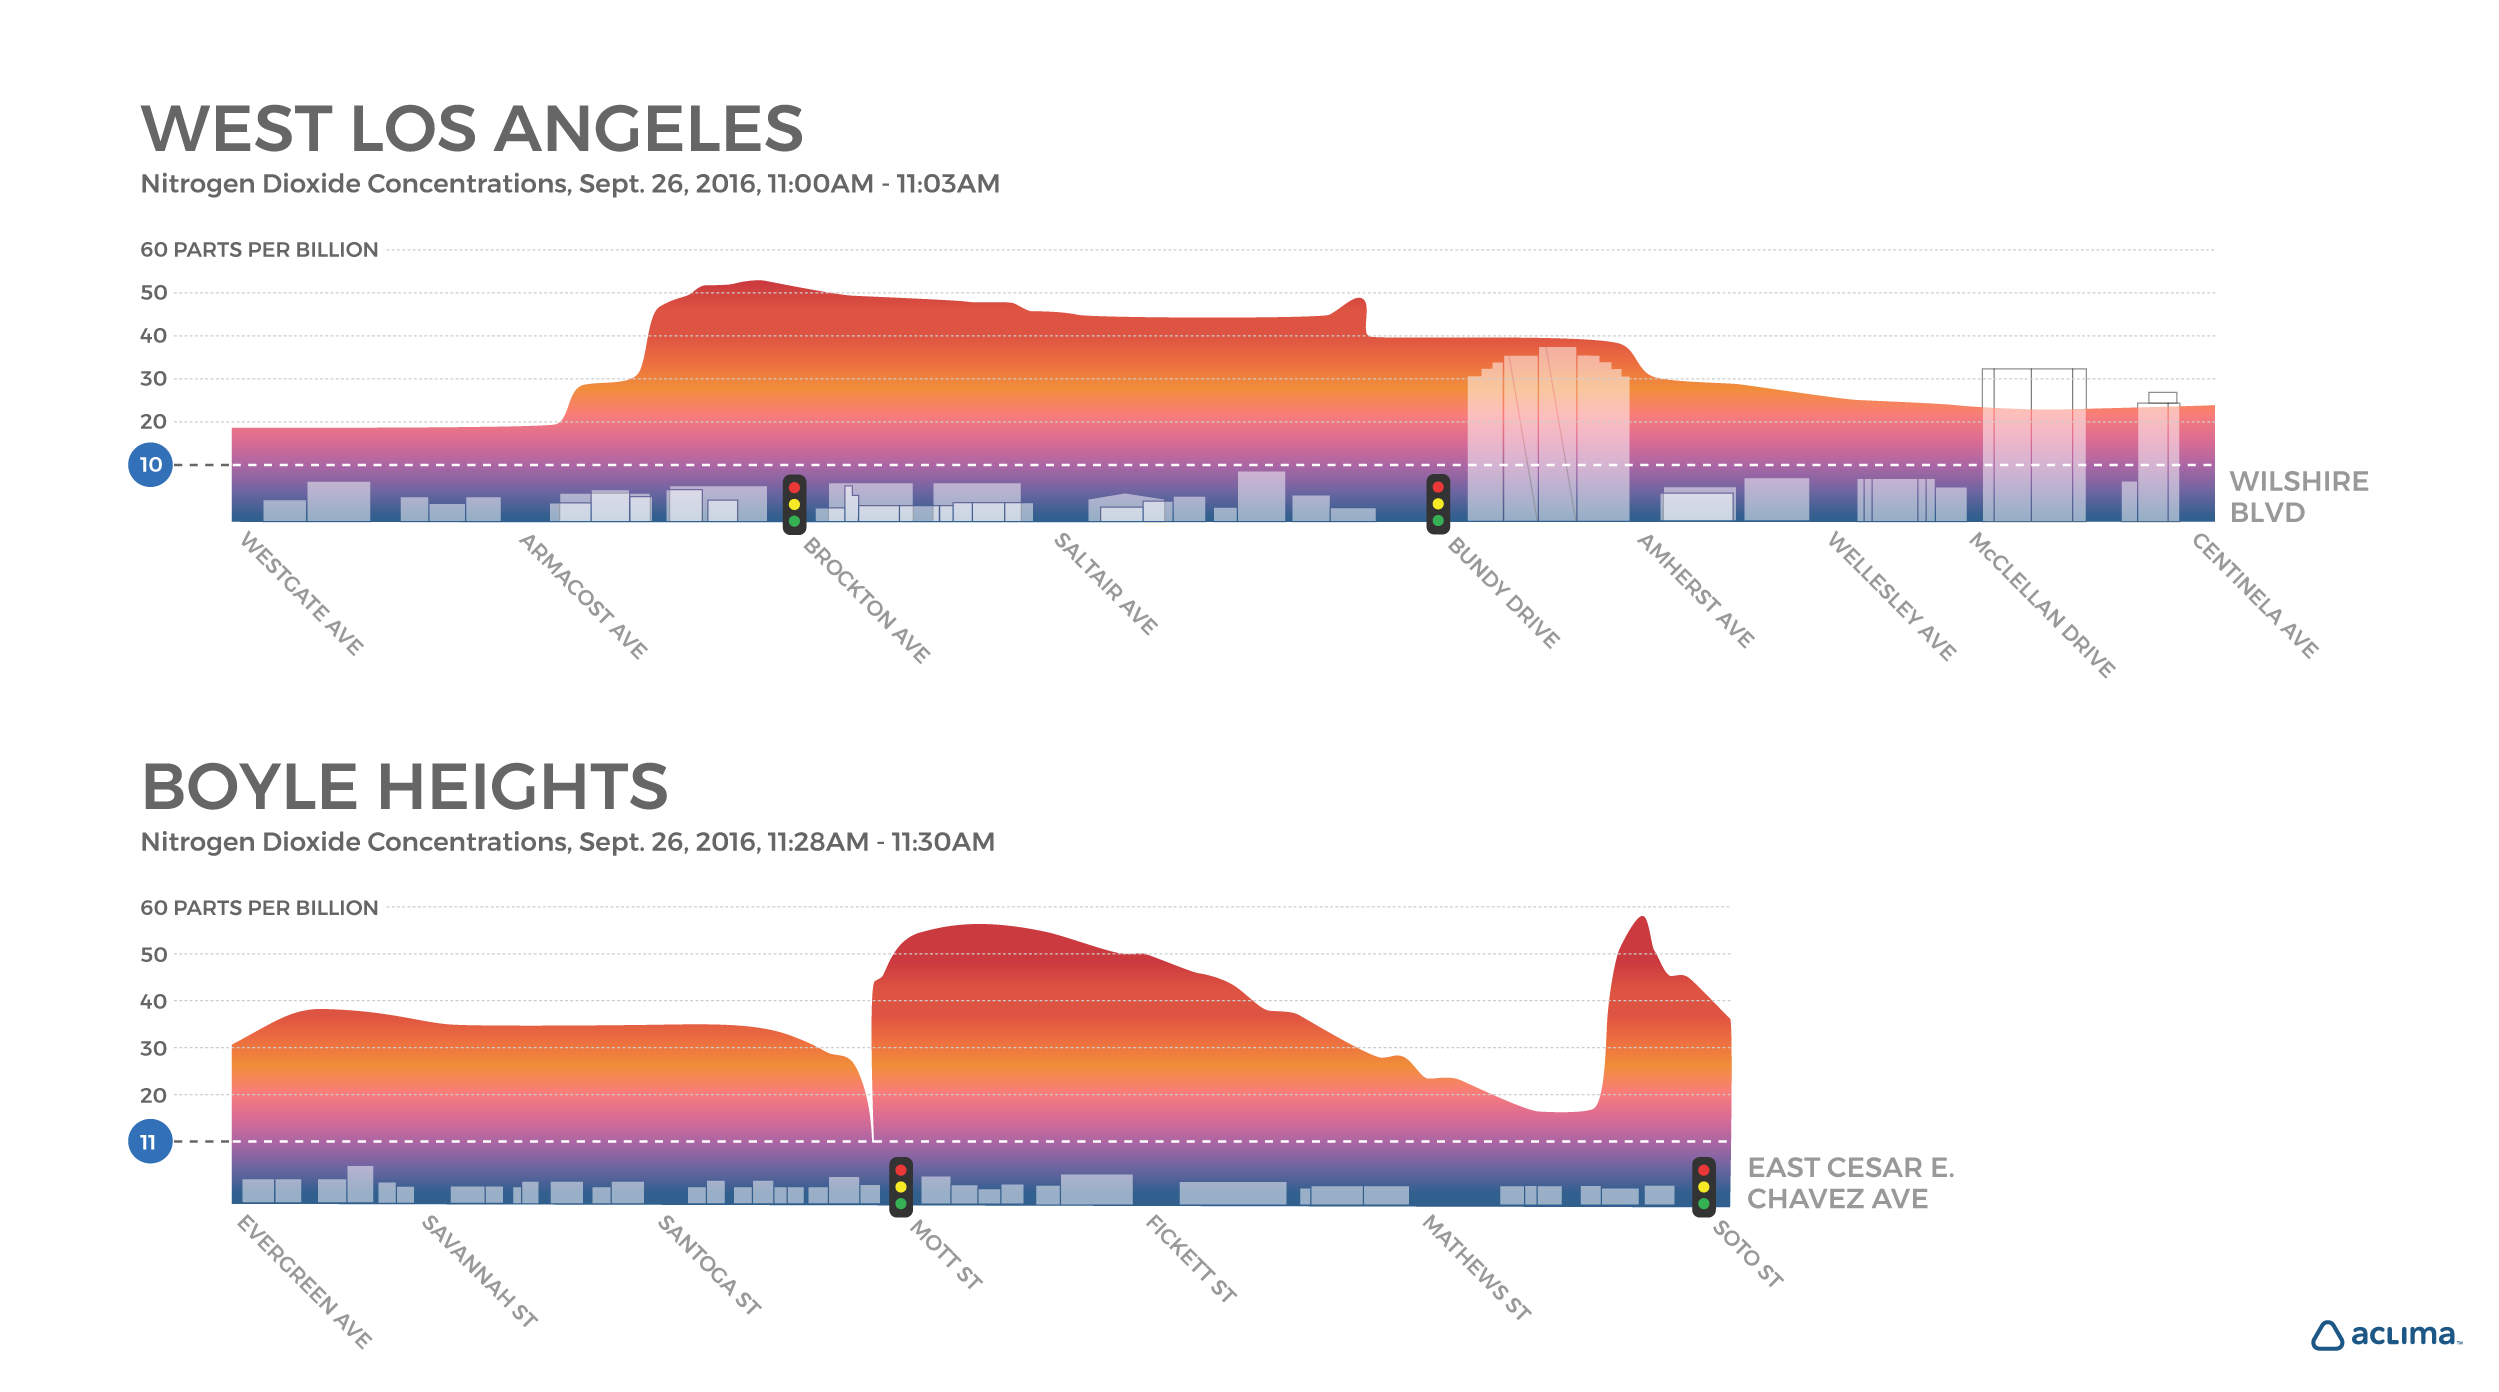
These measurements show that on a street-level, over the course of just 3 minutes, you can experience highly variable short-term exposure to air pollutants. One factor influencing this variability is the ebb and flow of traffic. The concentration of NO2 increased when cars moved forward after being stopped at the indicated from traffic lights. By visualizing emissions at the street-level, we are able to see how traffic patterns, traffic lights, and changes in street infrastructure may affect local emissions concentrations.
How We Did It
The two cars were deployed daily from our base at the Los Angeles Cleantech Incubator (LACI) near Downtown LA during the hours of 9:00 am and 5:00 pm. Transit time narrowed the hours between which we mapped individual neighborhoods. Our drive plans were created to equally capture morning, noon, and afternoon hours when possible. We measured the pollutants nitrogen dioxide, nitric oxide, ozone, black carbon, and particulate matter.
AQ&U
By measuring hyper-local air pollution, we can identify new opportunities for pollution control in transportation. Continued research can also inform us about ways to mitigate pollution and understand human health exposure in traffic. Experiments testing high-efficiency air filters in cars can reduce the concentration of ultrafine particles by up to 93 percent. With higher resolution environmental data, we can better understand short term exposure to pollution and take steps to manage pollution on our city streets and inside our vehicles to better protect our health and reduce climate-changing emissions.
Learn More
Read our data snapshots of Los Angeles, the Bay Area, and the Central Valley to learn about air pollution near LA schools, the worst wildfire season in California’s history, and what we found when we started mapping methane hot spots in the Valley.
Share this
Driving Science
Building Smarter and Safer Schools