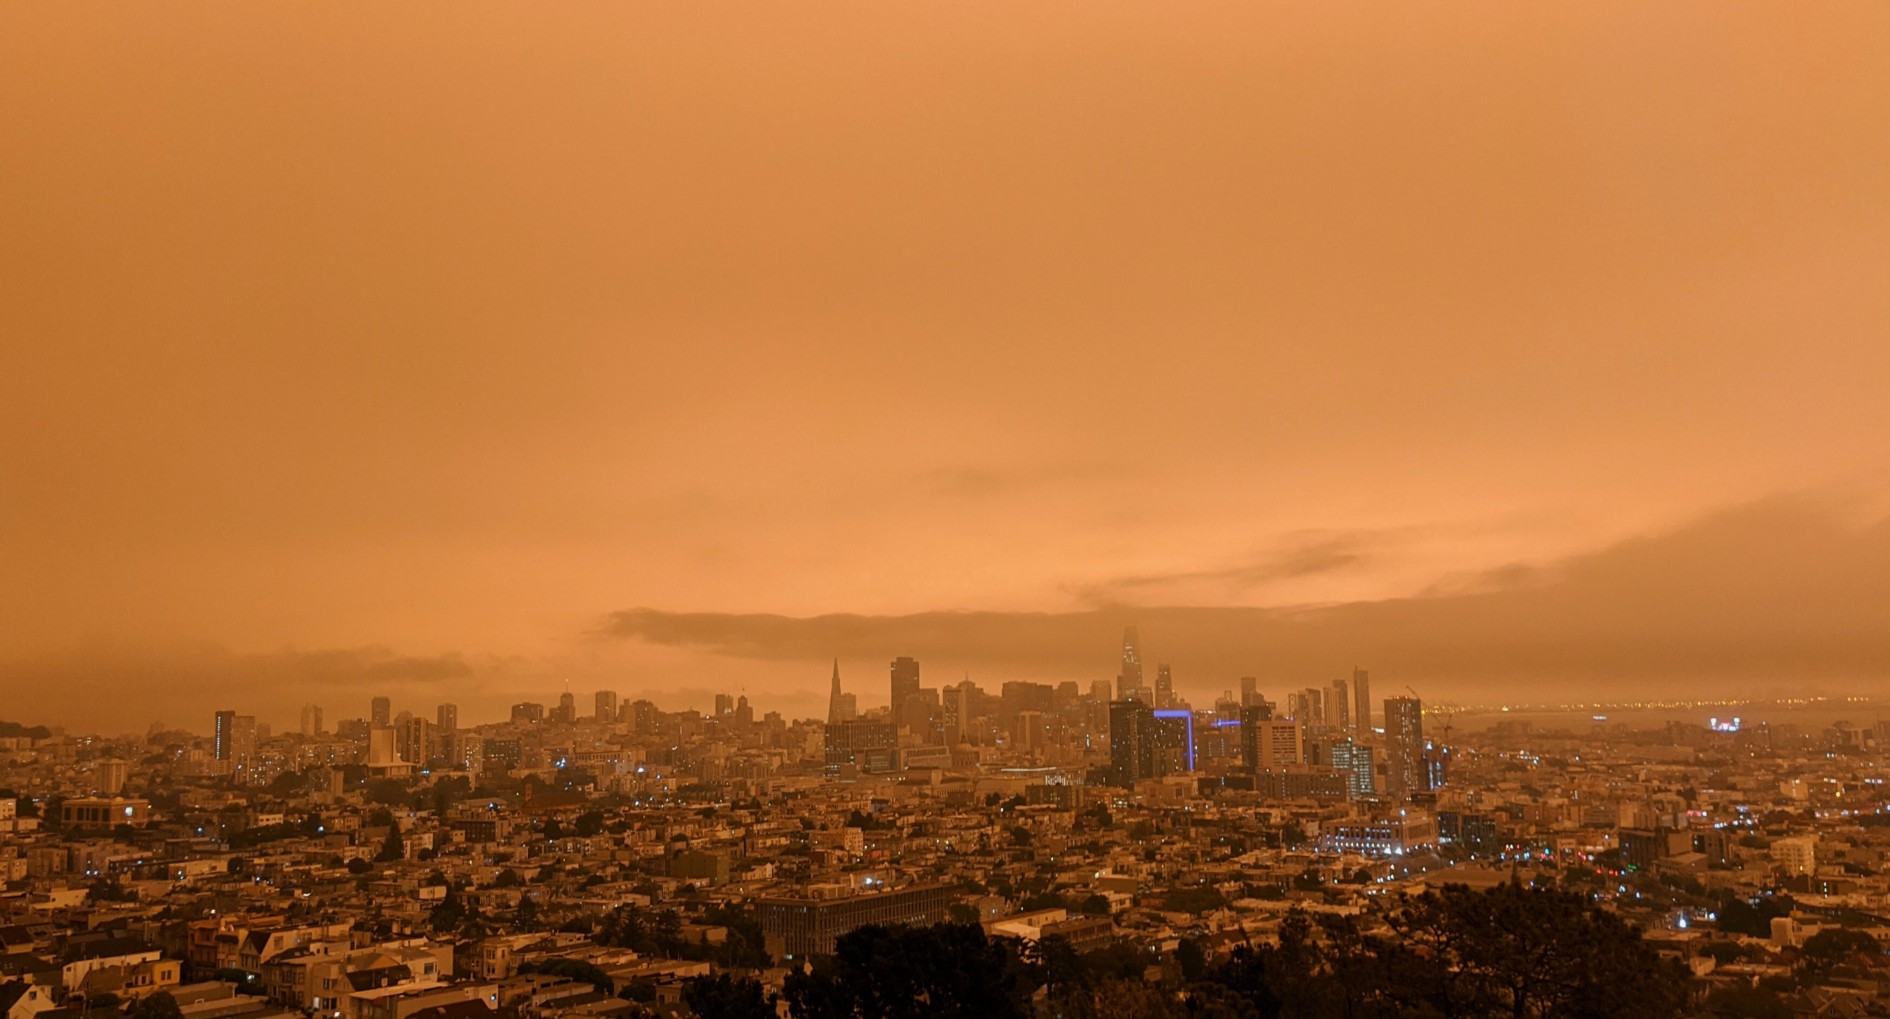
California’s Central Valley is often referred to as America’s Breadbasket, famously depicted in John Steinbeck’s Grapes of Wrath. Nearly 50% of U.S.-grown fruits, nuts, and vegetables are produced in California, in farms located in the Central Valley. Like dairy farms, the fields where alfalfa, rice, and strawberries are grown and harvested takes acres of space, seasonal tilling, and care. An output of this abundance combined with geography and weather, results in air pollution that is different from that typically found in urban areas.
For instance, dirt can be kicked loose during both the growing and fallow seasons, significantly impacting the particulate matter (PM) concentrations in the region. Commonly, agricultural practices, such as dairy and meat production, contribute to the emission of the greenhouse gas methane, which cows and other livestock emit.
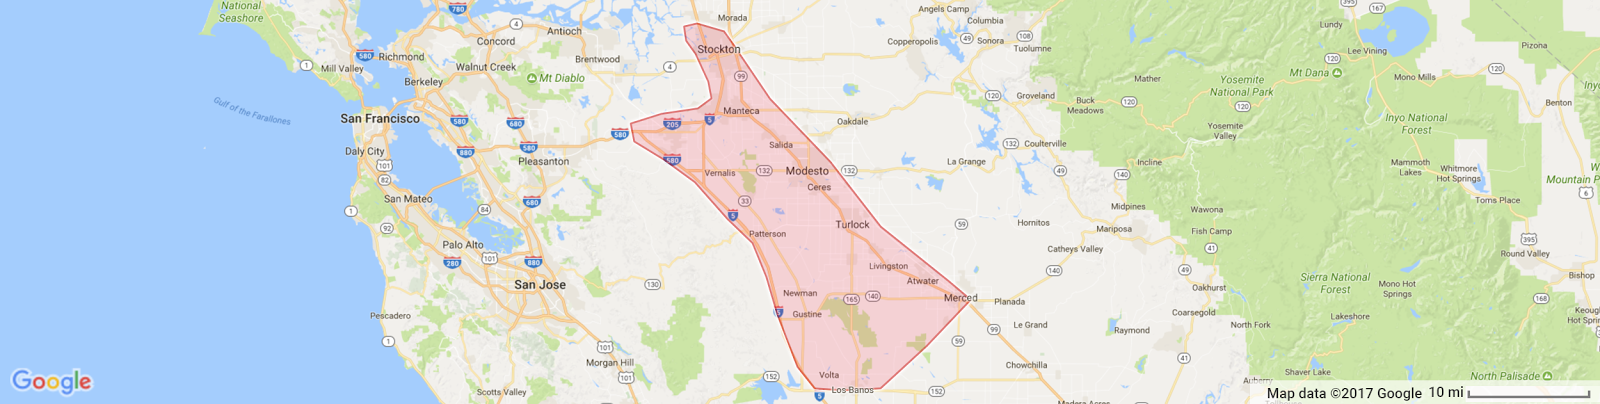
While a majority of the valley is rural, the San Joaquin Valley contains large cities, such as Fresno, Bakersfield, Stockton, Modesto, Merced, and Hanford, and is home to more than 4 million residents. Interstate 5 and California State Route 99, two major traffic corridors that connect Southern and Northern California, run through the region. Interstate and regional traffic, along with industry and commercials businesses, are also an important source of air pollutants in the region.
Add weather conditions to this picture and you have chronic ozone and particulate matter levels that exceed public health standards. Emissions from residents and industry of the valley combine with southwesterly winds that blow pollution inland from the San Francisco Bay Area and westerly winds from the Central Coast to trap air pollution between the coastal range and the Sierra Nevada mountains.
Providing residents with timely alerts about air quality conditions has helped introduce new data that residents can use to make informed decisions about when they should go outside and how to protect themselves and their families during poor air days. Hyperlocal data adds a new layer of real-time environmental intelligence that can inform policy decisions, agricultural activities, and everyday activities.
How We Did It
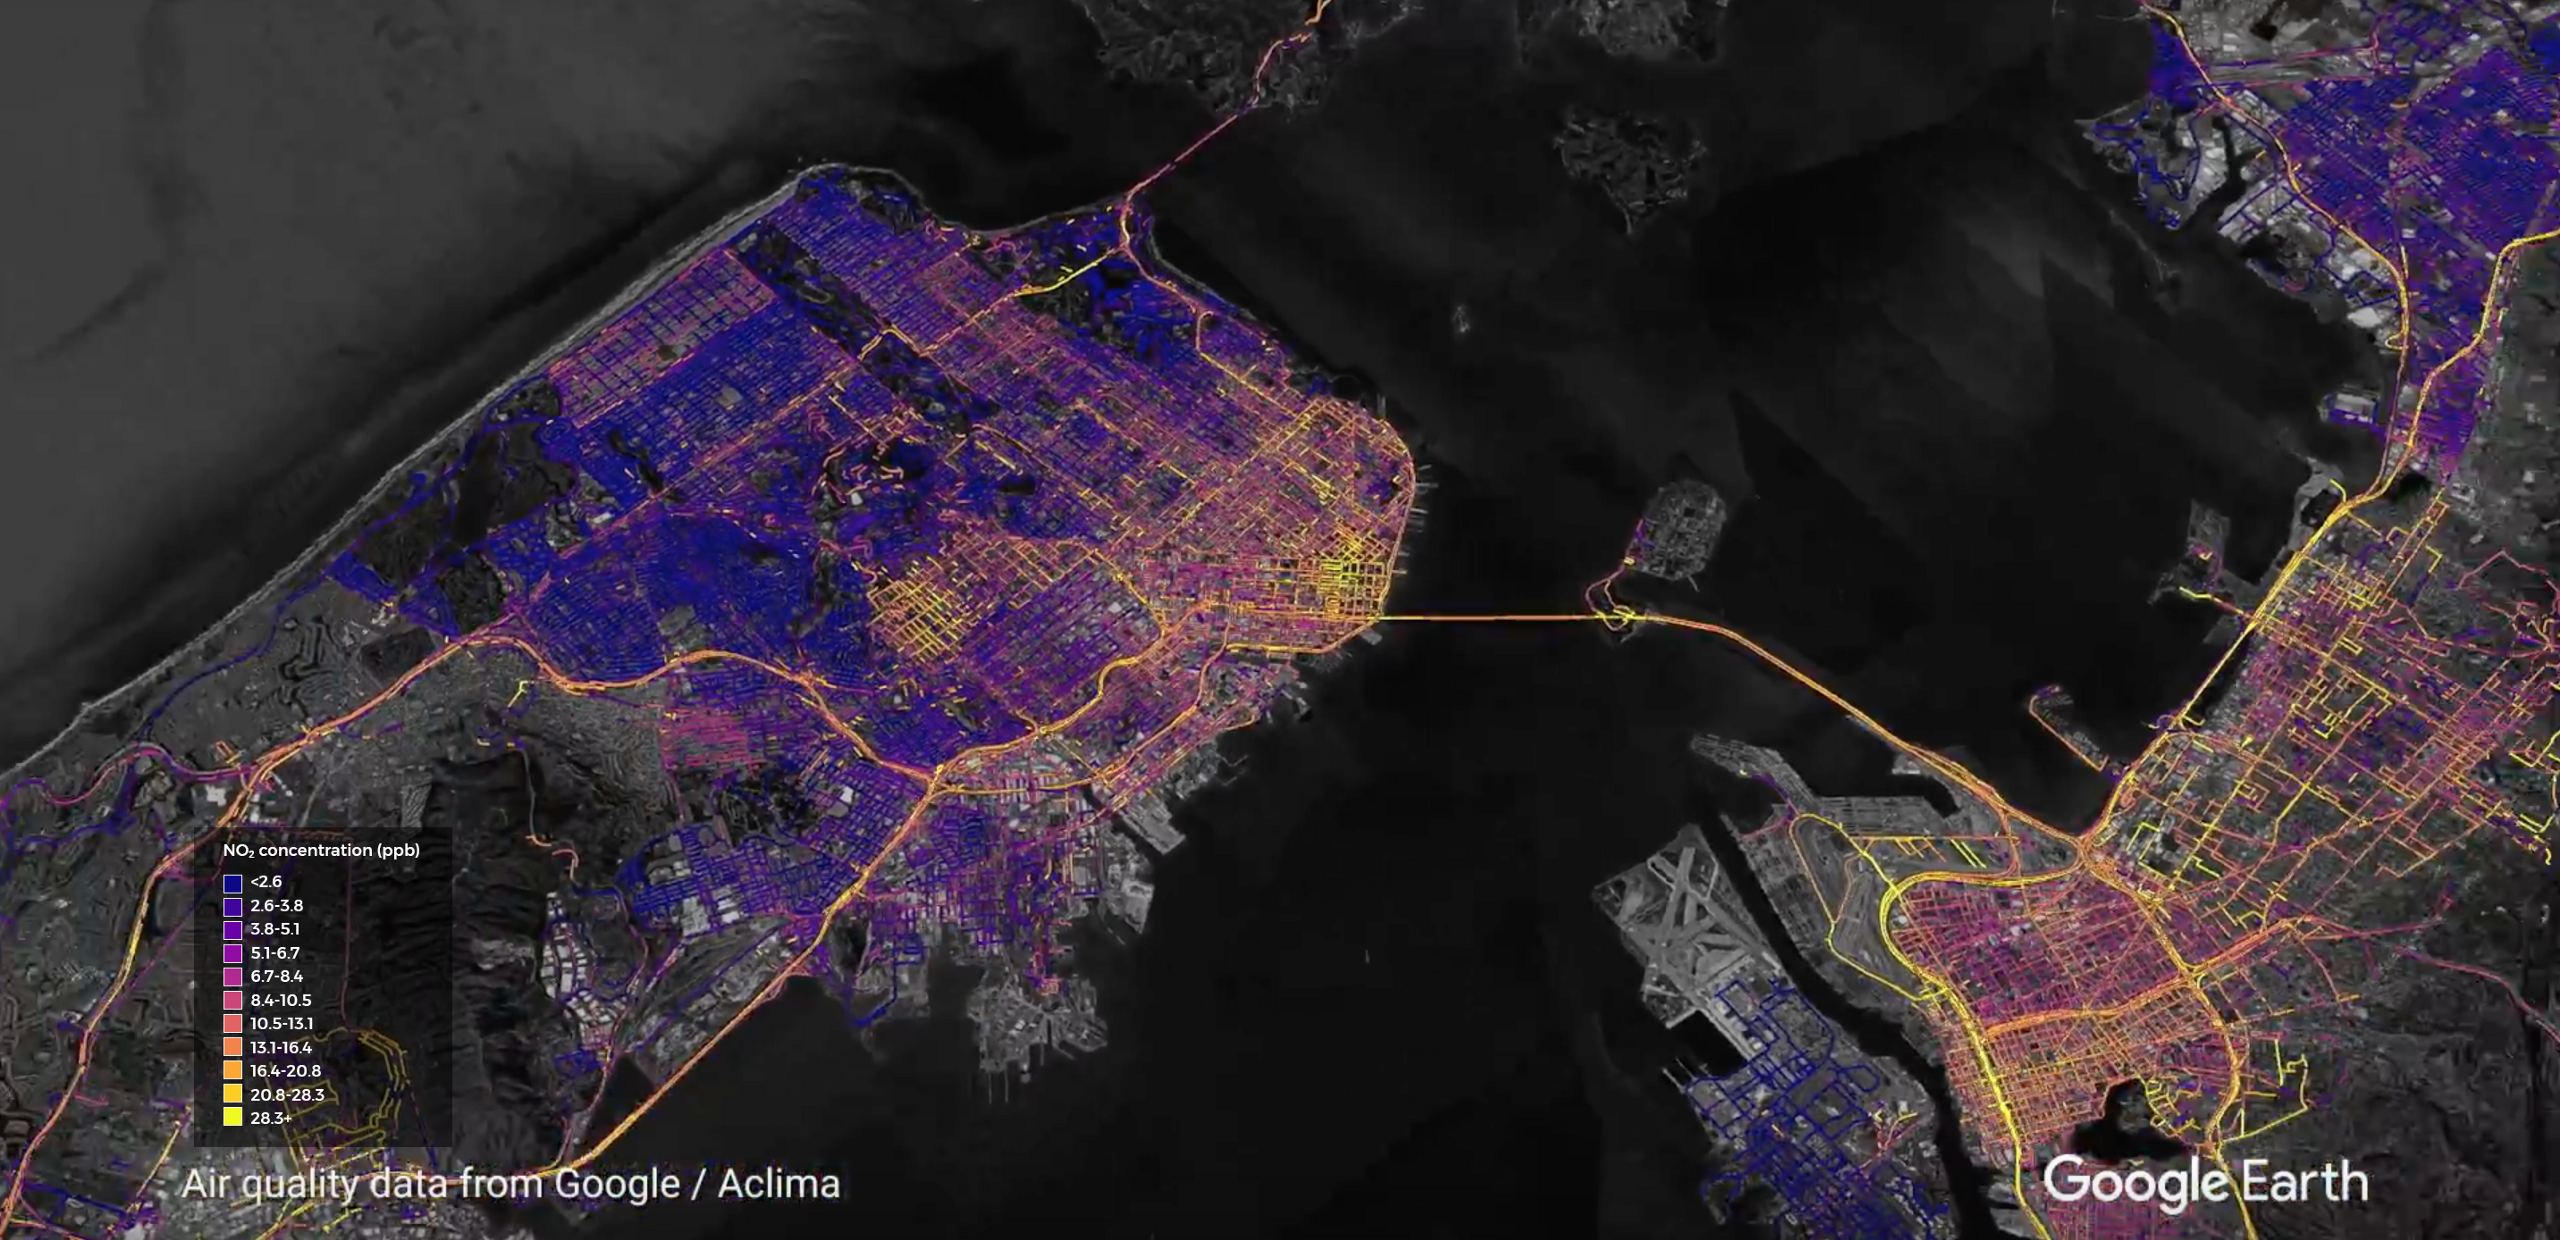
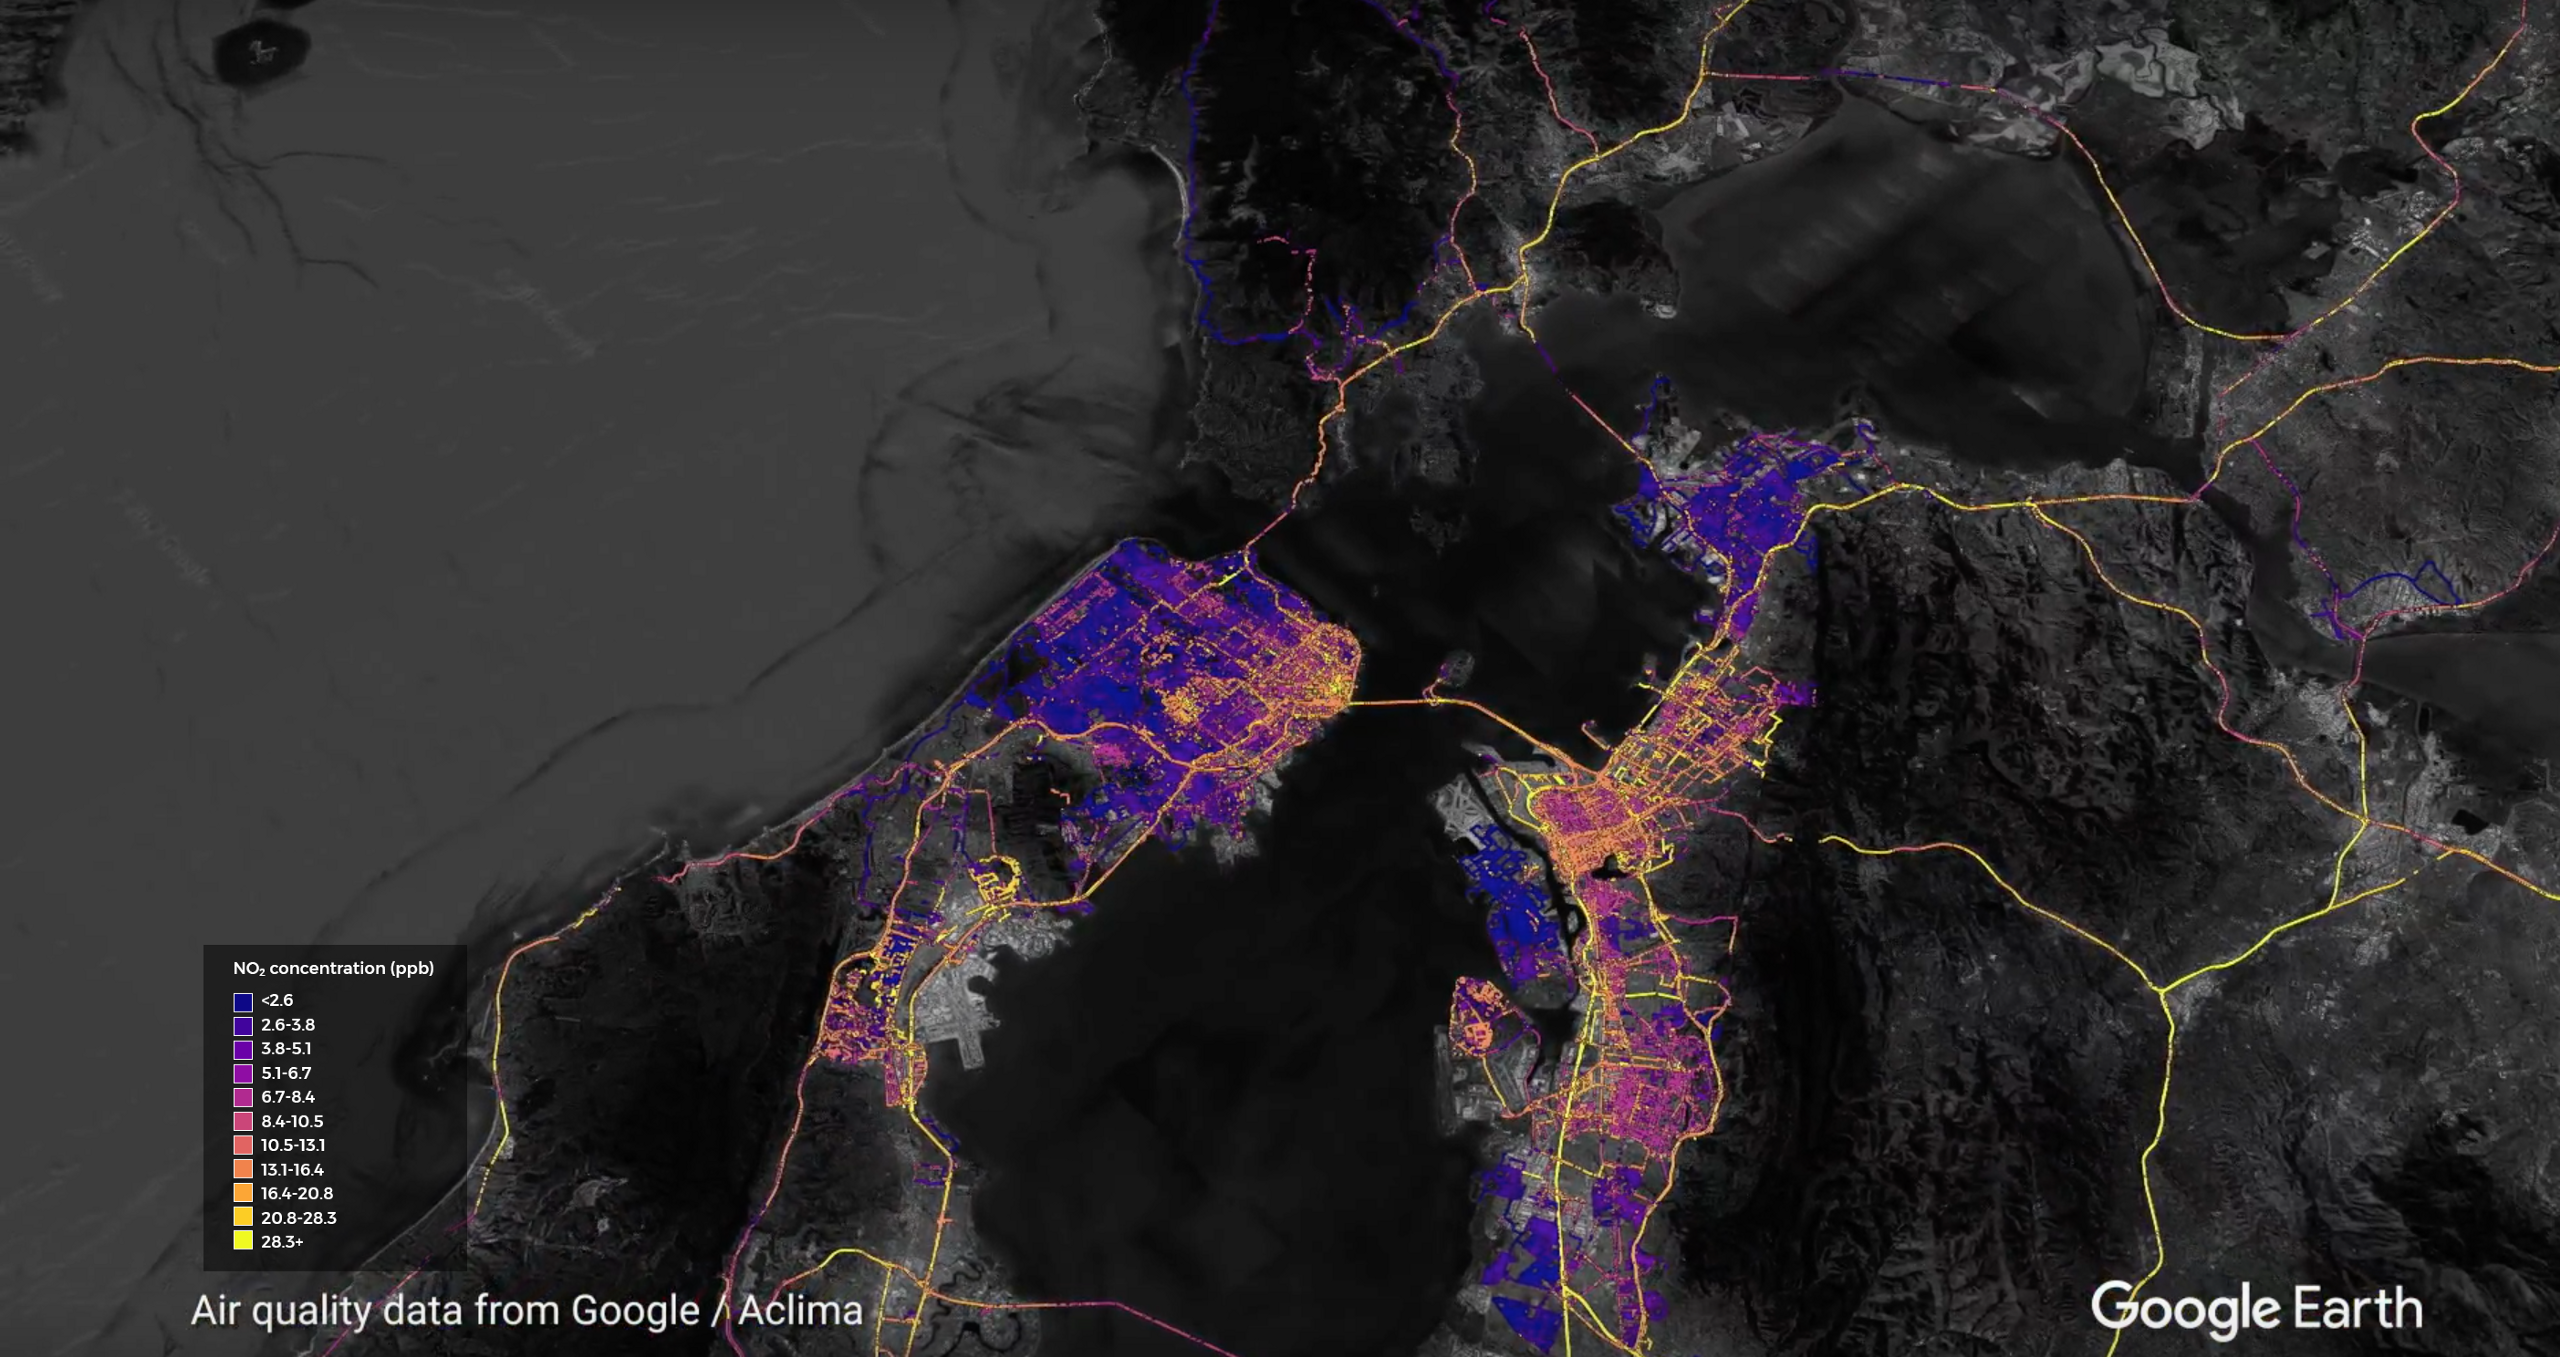
We drove in the northern San Joaquin Valley in the winter of 2016 to 2017 and again in the summer of 2017. In the first phase of driving, we mapped multiple different cities (Tracy, Stockton, Manteca, Merced, Modesto, and Turlock) with somewhat sparse spatial coverage. In the second phase, however, we chose to narrow in on a single city, Modesto, to achieve more dense spatial coverage in one region. We chose Modesto due to its unique combination of industrial, urban, and agricultural emission sources. In addition to mapping these different cities, we drove extensively along the two main freeways (I-5 and CA99) as well as a number of rural routes that connect these two freeways. The cars drove from Monday through Friday during typical work hours of 9:00 am to 5:00 pm. We measured the pollutants nitrogen dioxide, nitric oxide, ozone, black carbon, particulate matter, and methane.
Learn More
Stay tuned for data stories about these topics and read about why we decided to map these communities and how we did it.
Acknowledgements
We would like to thank the EPA’s Region 9 office, CalEPA and the San Joaquin Valley Air Pollution Control District for advice and support during the Central Valley area driving campaign.
Share this
Examining Air Quality in the City by the Bay
Wine Country Wildfires