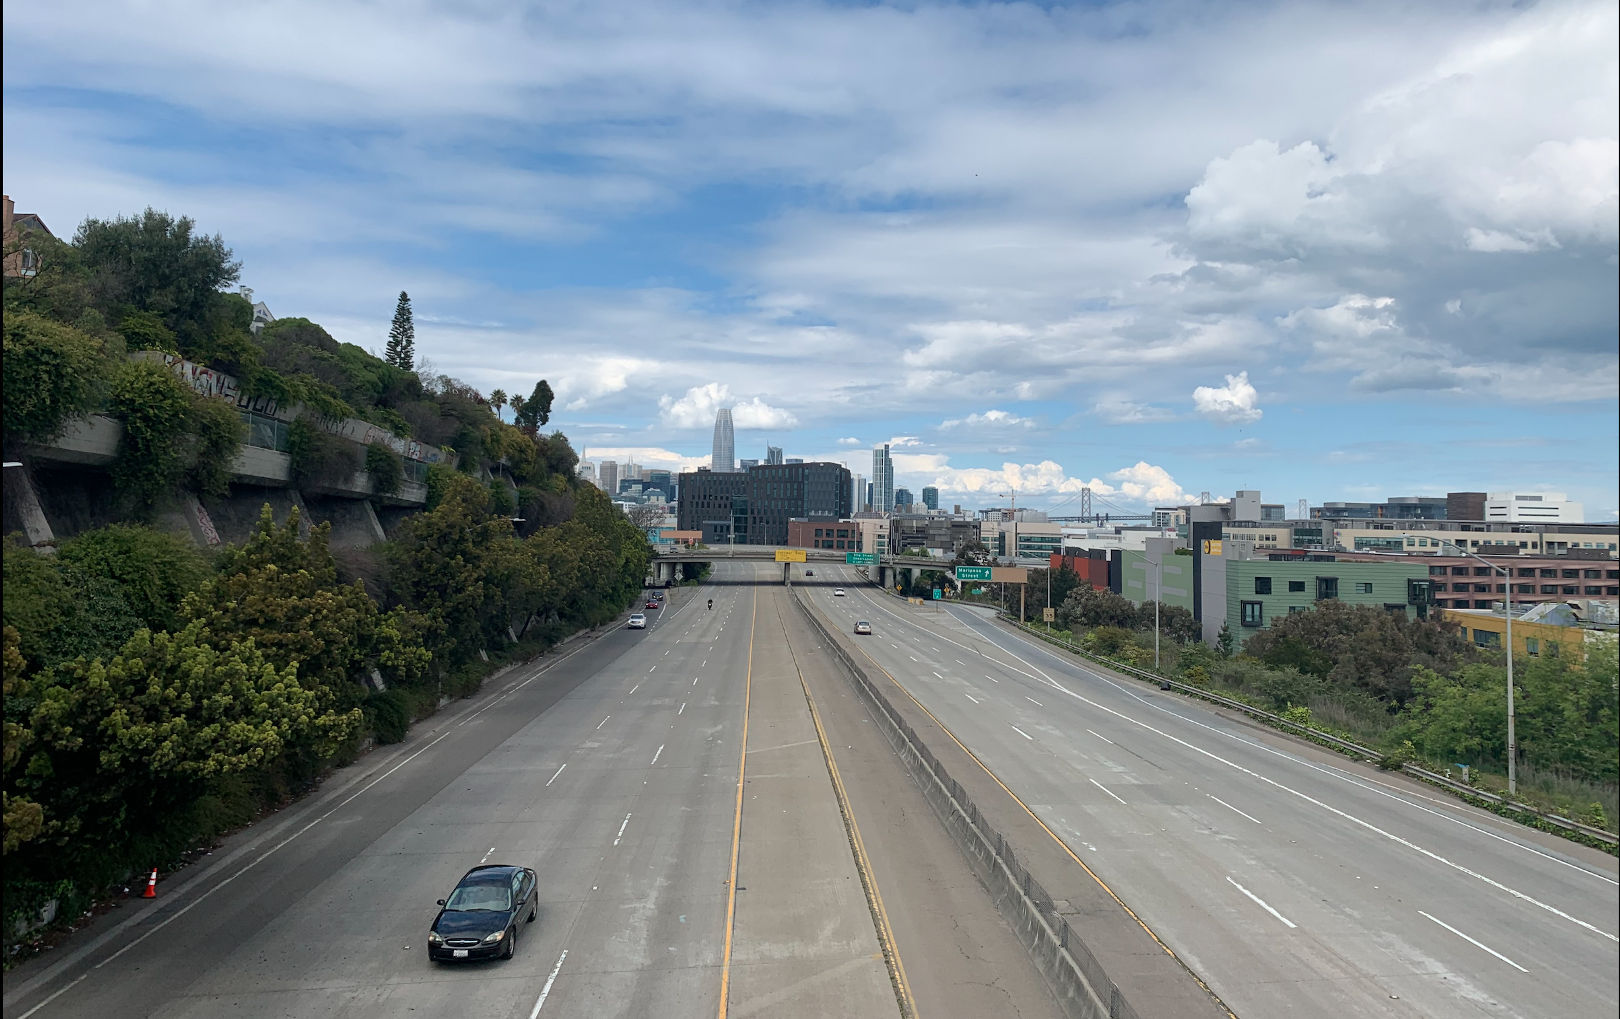
Californians have now been sheltering in place since March 20. While social distancing is slowing the spread of COVID-19, it’s also significantly reducing air pollutant and greenhouse gas levels across the state. Residents from San Diego to Sacramento are seeing clearer skies and breathing cleaner air, even in the center of cities that rarely experience a noticeable reduction in air pollution.
In previous weeks of our COVID-19 blog series, our scientists analyzed changes to Bay Area air pollution. This week, to explore how this phenomenon is unfolding across the state, we took a look at average weekday levels of ozone, carbon monoxide, fine particulate matter, nitrogen dioxide, and black carbon in every county in California over the past several weeks, and compared them to weekday averages over the same time period in years past. We focused on weekdays to highlight changes when traffic would be most impacted. Comparing air pollution levels with averages from previous years in the same timeframe helps account for changes due to seasonality.
Statewide California Air Pollution Decreases Dramatically
From March 20 to April 9, all pollutants analyzed fell across the board — including ozone — when compared to averages in the same timeframe from 2017, 2018, and 2019.
These decreases in air pollutant levels were similar and in some cases slightly larger than those we saw in the Bay Area over the same time period. While these drops were not uniform across the state, they were surprisingly consistent across the vast majority of counties. The video below shows how levels in each county in California changed in the weeks leading up to and during shelter-in-place. With few exceptions, air pollutant levels fell in nearly every county measured in the last week in March and the first week in April, compared to February.
The video shows week-over-week changes in air pollutant levels by county throughout California from February 2 through April 9, 2020. Cooler colors (blue) represent lower concentrations and warmer (orange) colors represent higher concentrations. To give a qualitative sense of the pollutant levels relative to one another, the counties are color-coded to represent higher and lower relative levels of air pollution. The corresponding bar charts show the pollutant levels by county levels each week, where longer bars represent greater concentrations, in parts per billion (ppb), parts per million (ppm), or micrograms per cubic meter (μg/m3).
County by County, Every Air Pollutant Drops
Fine particulate matter (PM₂.₅) levels dropped across the state, including counties in Central California, which often experience elevated levels of PM₂.₅ especially during the winter. Frequently elevated levels of PM₂.₅ and other pollutants in San Joaquin Valley (SJV) are related to the unique geography of the region, where episodic PM₂.₅ buildup events occur because of stagnant meteorological conditions in combination with excess emissions from urban, industrial and agricultural activities.
Fresno, Kings, Stanislaus, and Madera counties each had more than 70% reductions in PM₂.₅ when comparing average levels between March 20 — April 9, 2020 to average levels before the shelter-in-place order (Feb. 2 — March 2, 2020). Reduction in PM₂.₅ cannot be entirely attributed to shelter-in-place orders, however. Large decreases in PM₂.₅ in the SJV can occur seasonally, in the transition months between winter and spring. Additionally, rain events can cause a reduction in PM₂.₅ levels. More research is needed and underway to decouple the influence of seasonal changes, meteorology, and human intervention on PM₂.₅ concentrations observed.
Long-term exposure to high levels of fine particulate matter, which can either be emitted directly from a combustion source or formed in the atmosphere from complex chemical reactions, has been linked to cardiovascular and respiratory disease as well as cancer. Last week, Harvard released a study that shows that long-term exposure to even slightly elevated levels of fine particulate matter makes people more likely to die from COVID-19. Just a 1 μg/m3 increase in PM₂.₅ exposure over ten years increases the COVID-19 mortality rate by 15%.
Recent NO₂ approximations published in Nature from satellites show significant downward trends in NO₂ primarily for Los Angeles but not other large metropolitan areas in the United States. However, the ground-level measurements from regulatory sites presented here show how both NO₂ and NO (emissions associated with industrial and traffic activities, typically referred to as NOx) have been reduced across the state of California, including both rural and urban regions.
Unlike satellite approximations which give a birds-eye view of the entire column of air from space to the ground, ground-level measurements from regulatory sites and our own mobile sensor network represent the air humans breathe with high spatial and temporal resolution. Natural decreases in NO₂ concentrations occur in the Northern hemisphere relating to the angle of the sun from January to May. However, year-over-year comparisons of regulatory data indicate more than just seasonal causes for the significant decreases observed for NO₂ with the shelter-in-place order for California.
Carbon monoxide (CO) concentrations also dropped across the state with the shelter-in-place order. Processes that burn fossil fuel are a major source of CO in the ambient atmosphere. Kern County was the only county with observed increases in CO in this time period (29%).
While statewide average O₃ levels decreased by 5% compared to previous years, week-over-week changes show increasing O₃ for most of the state. O₃ is a secondary pollutant produced as a result of complex photochemistry and typically shows increased concentrations during springtime with more sunlight and increasing temperatures. As a result, interpreting the week-over-week changes and the impact of reduced traffic emissions is challenging. The year-over-year changes should take seasonality into account, but the relationship between emissions of precursors to O₃ (e.g. NOx and VOCs) and O₃ concentrations can vary significantly based on location (urban vs. rural), and other topographic and meteorological conditions. More research is needed to explain the changes observed in O₃ for most of the state.
A brief, statewide reprieve in air pollution
For decades, California has been at the forefront of improving air quality for the benefit of its present and future citizens. Still, our state has struggled to protect air quality in the face of rapid growth and the traffic and pollution that comes with it. The unprecedented shelter-in-place order for California has reduced the amount of traffic and other human-related activities that emit many air pollutants on a daily basis.
Since efforts to flatten the curve of COVID-19 began, we have observed significant reductions across the state for PM₂.₅, NO₂, CO, BC, and O₃ when compared to previous years of data. Looking at statewide trends, we can see that while air pollutant levels varied widely from county to county before shelter-in-place, counties with higher levels tended to fall further faster when traffic dissipated.
Ultimately, after a few weeks of dramatically reduced vehicle emissions, levels dropped across the board and became more uniform across the state. But for communities with disproportionate exposure to pollution, this is only a temporary reprieve. As the links between air quality and COVID-19 vulnerability become increasingly clear, this momentary pause in emissions offers valuable lessons that can inform future actions to protect public health.
By Caroline Parworth, Sensor Technologist, Aclima