On August 16, 2020, more than 10,000 lightning strikes pummeled the Bay Area, sparking wildfires across the region. Twelve days later, two of the three largest fires ever recorded in California history are still burning. Aclima scientists analyzed both regulatory and Aclima data to identify patterns in the impacts of these lightning complex fires on air quality.
Two patterns emerged:
-
On many days, inland counties experienced worse sustained daily air quality than Bay Area counties on average, whereas Bay Area counties saw larger maximum levels or spikes that were not sustained throughout the day as the wind dispersed and transported the smoke plumes inland.
-
When looking at diurnal or day-to-night hourly patterns, Bay Area counties experienced worsening daytime and improving nighttime air quality on average, from August 17–25.
For this analysis, our scientists focused on the daily average levels of fine particulate matter or PM₂.₅, which is a harmful pollutant generated by wildfires that is at least 50 times smaller than a grain of sand and typically invisible to the eye. Even if you can’t see or smell smoke, you may be breathing unhealthy air from wildfires.
Wildfires Fire Air Quality Impacts Felt throughout California
Aclima scientists calculated changing daily average levels of fine particulate matter on a county-by-county basis throughout California over eleven days (August 15–25) using regulatory air quality data from AQMIS generated from stationary monitors positioned at sea-level throughout California. They then overlaid satellite-detected VIIRS fire hotspot data from NASA FIRMS. Watch the daily PM₂.₅ averages by county as they changed in relation to the locations of fire hotspots as seen from space in the video below.
As you can see, on many days the wildfires appear to impact daily average PM₂.₅ levels in inland counties more than Bay Area counties as the wind dispersed and transported the smoke well beyond the fires.
Bay Area Counties with Active Wildfires Experience Daily Spikes in PM₂.₅
Even though this is the general pattern in the region, communities in close proximity to a fire can experience unhealthy pollution levels from wind-driven smoke at any time of day or night. Even though the daily average PM₂.₅ in inland counties tended to be higher than Bay Area counties, the daily maximum PM₂.₅ levels in Bay Area counties have often been at or above the rest of the state.
Bay Area Air Quality Improves at Night During Lightning Complex Wildfires
In addition to analyzing daily air quality in California following the lightning complex fires, Aclima scientists also analyzed data generated from Aclima’s mobile sensor network which measures air pollution and greenhouse gases, block by block across the Bay Area, day and night, weekdays and weekends. In Bay Area counties, a diurnal or day-to-night pattern emerged showing cleaner air at the ground-level in the evenings and early mornings with the highest levels of PM₂.₅ at midday. Unlike regulatory monitors, the Aclima mobile sensor network measures at various elevations on all publicly accessible streets.
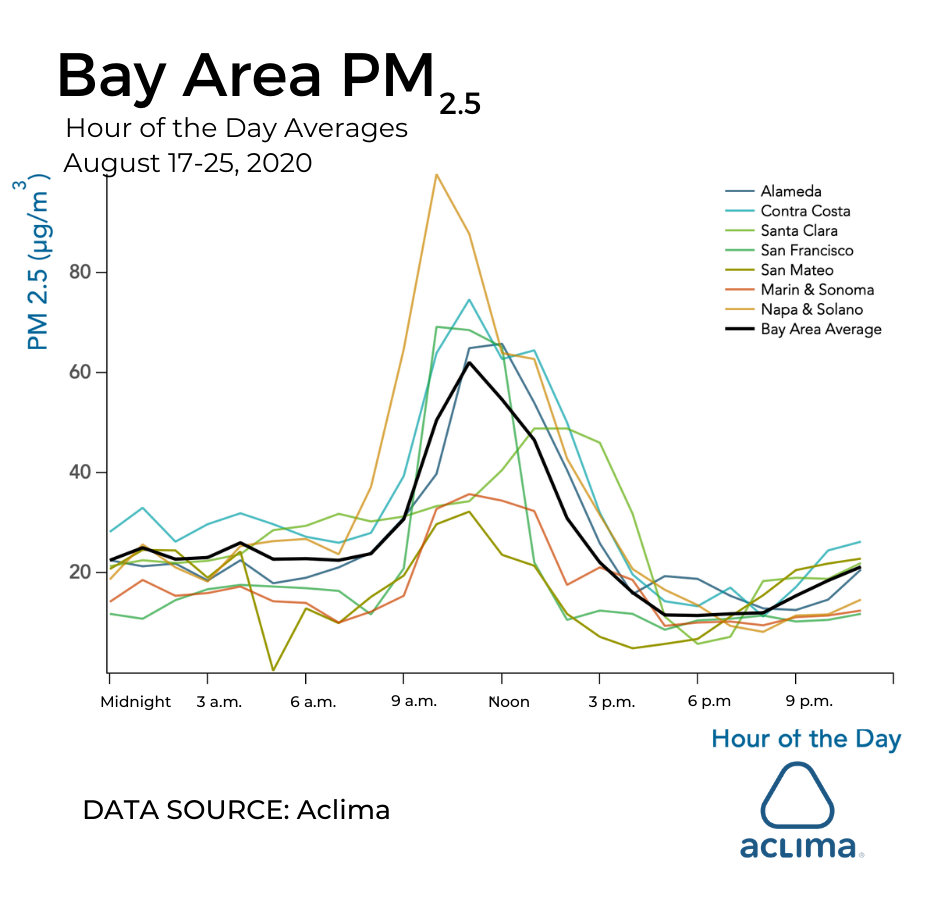
Typical summer meteorological patterns in the Bay Area drive this diurnal pattern in PM₂.₅ levels. During summer evenings, an inversion layer of cool marine air is trapped beneath a layer of warmer air. The marine layer is stable, meaning there is no exchange of air between this surface layer and the air above it. As the sun comes out and heats the ground, the height of this layer increases and there is more mixing of air both far above and near ground level. The difference in atmospheric pressure between the cool Pacific and the heating inland regions results in an onshore wind that starts to build mid-morning to a strong flow by late afternoon. As the sun sets, the evening inversion layer forms again.
Emissions from the fires are often found at higher elevations in the hills, and the nature of the fires causes the smoke to rise high in the atmosphere. In the evening, this smoky layer is above the inversion layer and does not descend to the ground-level. As this boundary layer grows during the morning, the smoke that has been held high above the ground mixes into this layer and the concentrations increase at the ground. Direct smoke emissions are also more likely to mix into this layer during the day. As the winds pick up, this smoky air is blown out of the Bay Area towards the east and replaced by clean air from the Pacific. Then as the sun goes down, the reformation of the evening inversion layer results in clearer air being closer to the ground and where we breathe.
This isn’t to say that air quality at night has been better everywhere, but it’s certainly shown a strong tendency to be measurably better on a county level throughout the Bay Area as long as this typical summer meteorological pattern is active. People can benefit from this pattern by planning essential outdoor activities during the morning or evening, or opening windows overnight to help cool the house down if they don’t have air conditioning.
The fires have caused incredible damage, taking lives, homes, wildlife and critical habitat, and displacing tens of thousands due to evacuations. Millions of people are being exposed to unhealthy air quality across and far beyond California due to these historic fires. While we can see the wind blowing smoke out of the Bay Area during the day, and the atmosphere pushing that cleaner air down to us at night, it does not remove the smoke completely.
Emissions are changing our planet and harming our health. In just the last two weeks, we’ve seen a historic lightning storm spark massive fires in California, and Hurricane Laura rapidly intensify into a Category 4 storm in the Gulf of Mexico, both of which are strong signals of the extreme weather expected from climate change. Air pollution and climate change are not confined to county, state, or country borders. These historic events underscore the urgent need for climate action, no matter where you live.
Editor’s note: this article reflects patterns in air quality up until August 25, 2020. Meteorological and fire conditions are always evolving. For hourly Bay Area air quality information please go here.